Geoscience Reference
In-Depth Information
450000
400000
350000
300000
250000
200000
150000
100000
50000
0
1/1/1976
7/19/1976
2/4/1977
8/23/1977
3/11/1978
9/27/1978
Ti me (D a y s )
Observed Sediment
Validated sediment
Fig. 3. Comparison between “observed” and simulated Simiyu daily sediment for the
validation period from 1976 and 1978 at Main Bridge outlet (Abdelhamid, 2010)
2,500,000
2,000,000
1,500,000
1,000,000
500,000
0
Observed sediment load
Simulated Sediment load by SWAT
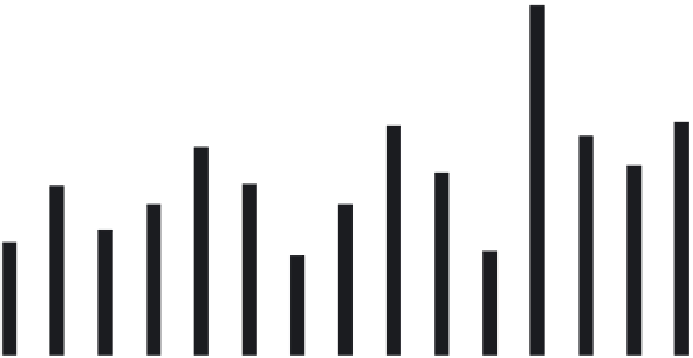
Fig. 4. SWAT simulations vs observed annual sediment loads at Case study 1, the Koka
Reservoir, between 1990 and 2004 (As adopted from Endale, 2008)


Search WWH ::

Custom Search