Geoscience Reference
In-Depth Information
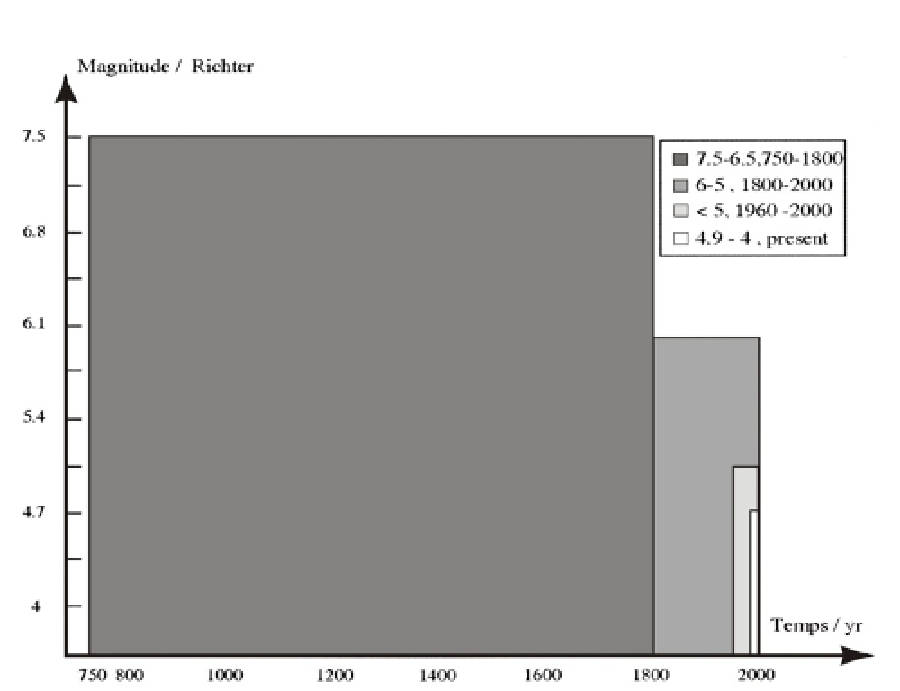
Fig. 10. Histogram of the seismicity evolution in time, after their magnitude and age.
For recent seisms, we have collected good data, especially from the physical effects on the
structures and the station seismic net (Fig.11). They are distributed in the whole of the
country and in the off shore.
4.2.3 Seismic hazard zoning map of Syria and Arab plate
In order to evaluate the seismic hazards on the whole territory of Syria, and to examine their
effect on building structures, odometric experiments on the more representative soil types
occur in the country, have been performed in laboratory. Using scale of magnitude intensity
of 7, 7.5, 8, and 8.5 respectively, the elasticity modulus (E = power/surface = Kilo Newton /
m
2
), and the Poisson ratio (P=executed displacement / original displacement = deformation
%), have been determined. They allow the determination of the soil rigidity and the
behavior of building during a seism (interaction soil-seism for a given building). The
experiments have been measured on more than 80 litho- logical samples. Measurements
were analyzed using the SAP Software (computer and structures Inc. USA, Bilal and
Mahmoud 1997). Results are given in terms of relative unity response to seismic hazard,
namely relative damage, the result of seism-soil effect on building, estimated from low to
strong. It is maximal along the rift (moderate), and decreases gradually towards the East,
East South and East North (low) in line with the rate movement, and
seismic acceleration coefficient evolution (Fig.12B).
Search WWH ::

Custom Search