Geoscience Reference
In-Depth Information
5. Application to digitalized core image data
Here, the local regularity analysis is performed on digitalized core image data. The analyzed
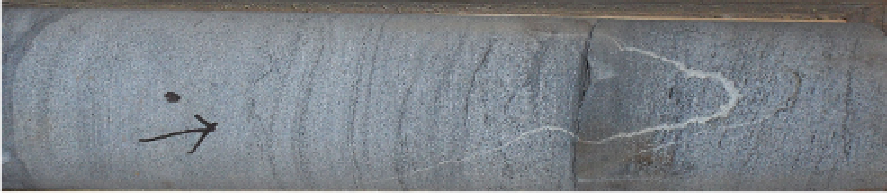
core is extracted from a well drilled in an Algerian basin. It is chosen since it represents the
main geological features of the studied region (Fig.4).
The core presents medium to fine quartzitic sandstone, clay and quartz cemented cross
stratifications underlined by mud films. The formation is affected by a main fracture F1 with
a high angle dip (≈75°) filled with quartz. It is also noted the presence of another fracture F2
sub-parallel to F1 but less important.
F2
F1
Mud films
Break
Fig. 4. Core image.
The processing of the core image requires first its digitalization. The core image is
digitalized and codified in gray levels with integer values ranged between 0 and 255. The
obtained digitalized core image, illustrated by figure 5, corresponds to a matrix of 3642 x 996
with a sampling rate Δ
x
=Δ
y
=0.0121 cm.
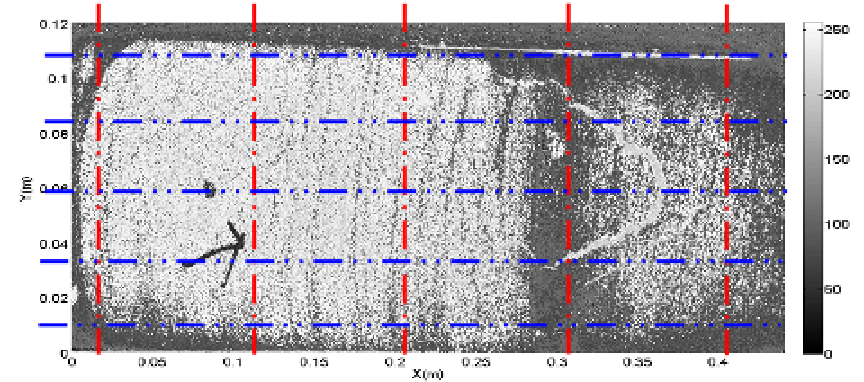
First, the fractal behavior of the digitalized core image data is inspected on five horizontal
and five vertical profiles as shown in Figure 5.
2
4
5
1
3
5
4
3
2
1
Fig. 5. Positions of the horizontal and the vertical profiles on the digitalized core image.
The horizontal profiles numbered from 1 to 5 (in blue) correspond to the respective
positions
y
= 0.0120 m, 0.0361 m, 0.0603 m, 0.0845 m and 0.1087 m, while the vertical profiles
numbered from 1 to 5 (in red) correspond to the respective positions
x
= 0.0241 m, 0.1208 m,
0.2175 m, 0.3142 m and 0.4109 m.


Search WWH ::

Custom Search