Geoscience Reference
In-Depth Information
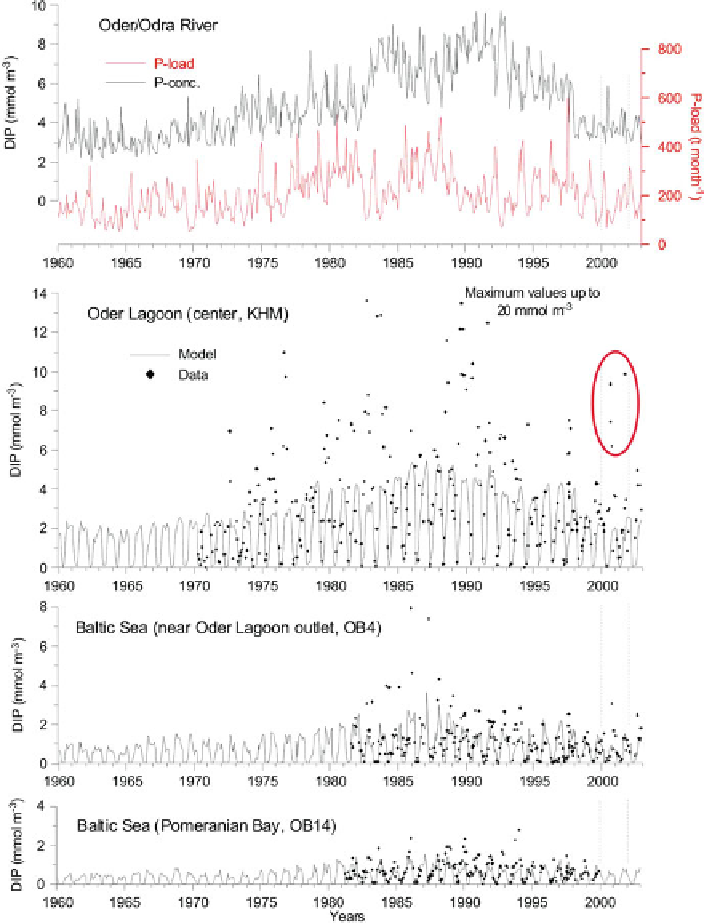
Fig. 18.2
Phosphorus loads (bio-available P) and concentrations (dissolved inorganic P, DIP) in
the Oder River and in the estuary. The labels and years indicate the 1st of January. Oder river
loads are based on MONERIS model simulations. In the estuary, concentrations simulated with
the ERGOM model are aggregated to monthly averages, while the data represent single samplings
near the water surface (data source: LUNG, Güstrow). The focus years of this study (2000 and
2001) are indicated