Geoscience Reference
In-Depth Information
voluminous. To investigate the causes of this barrier size distribution, numerous
drillings and GPR surveys on the barriers, vibrocoring and SES surveys offshore
and in the lagoons were carried out. The extensive fieldwork resulted in an in-depth
knowledge regarding the internal structure and facies distribution of the sediments
from which the relief prior to the transgression can be deduced (Fig.
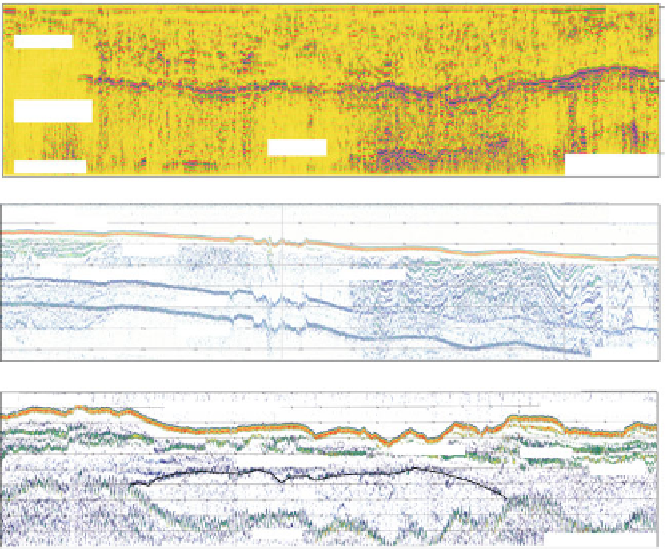
12.5
shows
examples). In the coastal area from Usedom Island in the east to the Fischland in the
west, the Pleistocene uplands consist predominantly of glacio-fluvial/lacustrine sand
with some till beds and are characterized by a highly undulating relief with eleva-
tions up to +60 m and interjacent depressions down to -20 m. Up to a level of c. -12
to -8 m the depressions are filled with slightly carbonate-bearing fine-to-medium
sand, containing diatoms and molluscs, indicating cold freshwater environments
Glacial sand dips very slightly to -15 to -18 m northwards towards the proper Baltic
depressions are indented and completely filled with interbedded fine sand and silt
S
N
0
A
m
msl
Marine sand
-5
Marine sand-mud
interbedding
Marine base
-10
100 m
Glacifluvial sand
S
N
Marine fine sand
Marine mud
-6
B
msl
Marine base
-10
Peat
Pleistocene fine sand
Pleistocene silt
1st multiple
-14
2nd multiple
500 m
E
W
-6
Marine fine sand
Marine coarse sand / gravel
Marine coarse sand / gravel
m
msl
C
Marine fine sand
-10
Marine mud
Pleistocene fine sand
Marine base
Till
-14
1st multiple
500 m
Depth is calculated as 0.053 m/ns.
b
and
c
Examples of SES records from the Falster-Rügen plane;