Geoscience Reference
In-Depth Information
Gedser
C
0.9
0.6
1.0
Saßnitz
B
Puttgarden
0.8
0.7
Barth
1.2
A
Warnemünde
1.6
1.1
1.4
Travemünde
Swinemünde
Wismar
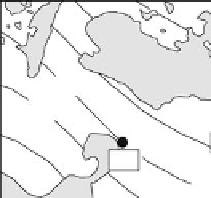
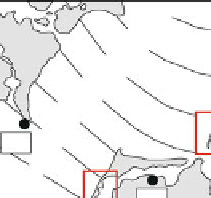
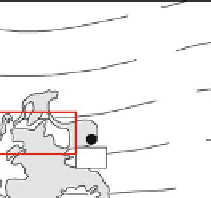
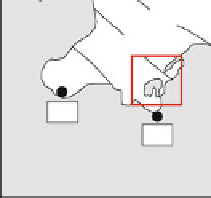
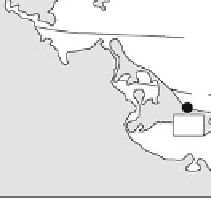
Fig. 12.2
The Wismar Bay (
A
), Fischland (
B
) and north Rügen/Hiddensee (
C
) study areas and cur-
rent relative sea-level rise (mm/year) at different gauge stations in the southern Baltic Sea (Dietrich
only slightly, and shoreline evolution was characterized mainly by progradation and
dune belt development.
The recent relative sea-level change was investigated using repeated precision
rise on Rügen than is at Wismar. The eustatic rise during the past 100 years is
responds to the relative rise between the Fischland and the coastal section west
of Warnemünde and means that a slight but increasing crustal uplift occurs from
there towards Rügen and a subsidence towards Wismar and Travemünde. This was
isobase as the isoline where the glacio-isostatic emergence fades out.
12.3 Data Acquisition
Sea-level curves deduced from regionally distributed data might be flawed by differ-
sampling areas not larger than 15-30 km in diameter to guarantee that differences
in the crustal movement within the area are small and negligible. For this investiga-