Geoscience Reference
In-Depth Information
10.5 Results
The seafloor slope map allows to visualize the step-like structure of the underwater
slope of the Gdansk Deep, with the structure being dependent on the fossil coast
and generally coincide with mid-lines of the cliffs. The exceptions include only
19°30'E
20°E
20°30'E
Legend
Cliffs
SAMBIAN
PENINSULA
10
11
12
13
14
1
2
3
4
5
6
7
8
9
19°30'E
20°E
20°30'E
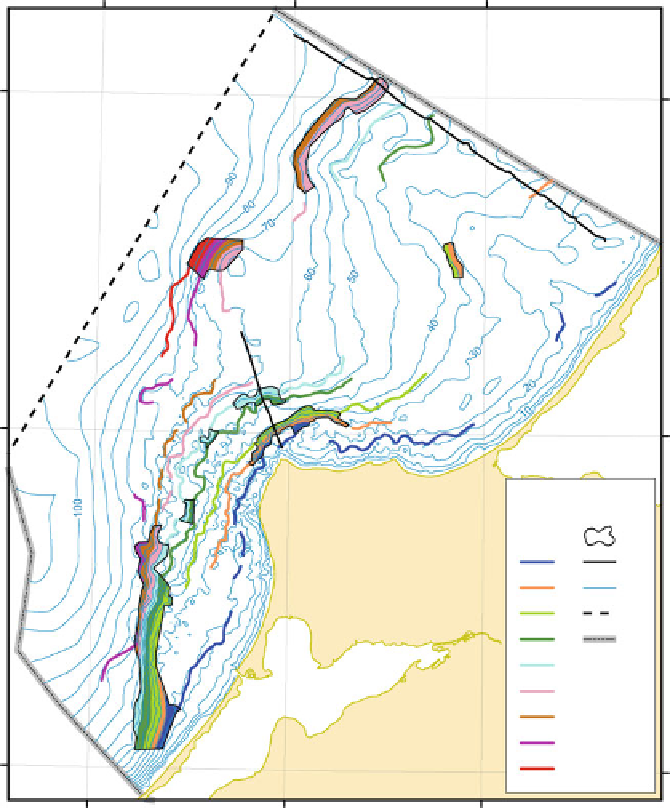
Fig. 10.3
Axial lines of submerged cliffs (average depths (m):
1
, 21;
2
, 29;
3
, 38;
4
, 48;
5
, 53;
6
, 62;
7
, 68;
8
, 76;
9
, 88;
10
, limits of polygenetic submerged cliffs with
colours
corresponding
to individual cliffs;
11
, location of certain typical echo-sounder profiles (P1 and P2);
12
, offshore
boundary of the study area;
13
, isobaths (m);
14
, Russian state and EEZ borders