Geoscience Reference
In-Depth Information
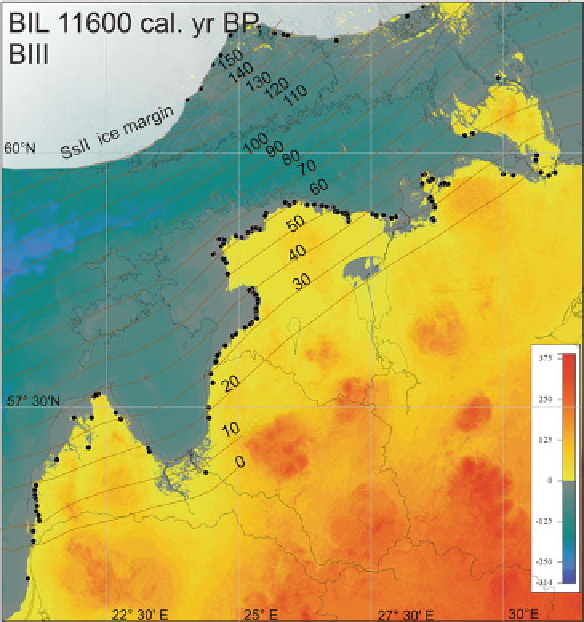
Fig. 9.6
BIL 11,600 cal. years BP, stage BIII. Isobases show the reconstructed water level above
present sea level in metres.
Black dots
show the location of used shoreline sites
9.4 Discussion
Modelling results demonstrate BIL at five different levels showing that land uplift
induced regressive shore displacement between 13,300 and 11,600 corrected varve
years BP. Shoreline data of Latvia, Estonia, NW Russia and Finland are generally
in good agreement. Latvian and NW Russian shoreline proxies helped to improve
water level reconstruction for Lakes Võrtsjärv and Peipsi. The isobases of stages BI,
BII and BIII show a generally regular pattern of uplift all over the study area. The
uplift in NW; however, in the Lake Peipsi basin, isobases curve remarkably towards
SE, being up to 8 m higher than expected from the regional pattern. The main rea-
son of curving is anomalous lowering of the tilting gradient that was mentioned by