Geoscience Reference
In-Depth Information
8.3.3 Temporal and Spatial Water-Level Change Model
Temporal interpolation of interstage surfaces for a certain time period was provided
by linear calculation according to the water-level change curve developed using the
using the following equation:
L
n
−
A
n
H
ni
=
A
n
+
T
i
+
d
i
,
T
where
A
and
L
are the section's older and younger reference surfaces, respectively,
T
is the length of time between stages
A
and
L
,
T
i
is the time from initial stage
A
,
and
d
i
is the difference in the water-level change curve of the sample site from the
linear trend line. We had two assumptions in using the simple linear model: first, the
study area was small enough to be characterized by homogeneous dynamics, and
second, the six reference surfaces inserted into the calculation describe the temporal
behaviour of the water level by sufficiently frequent stages that gradient differences
in a section do not produce deviations that exceed uncertainties from elevation and
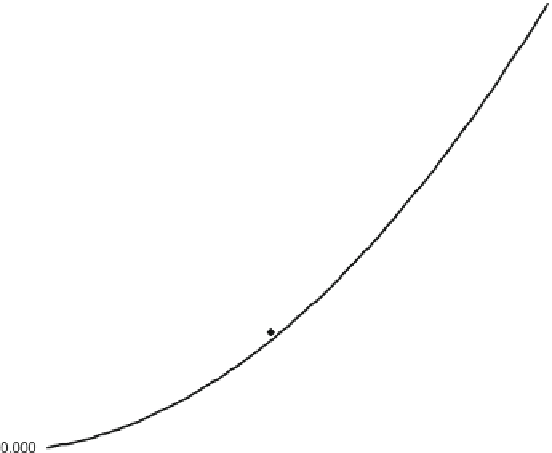
Fig. 8.5
Water-level surface tilting gradients for different times and polynomial trend line showing
the decay of land uplift over time. Mean tilting gradients of water-level surfaces and the directions
of fastest uplift are given in Table
8.2