Geoscience Reference
In-Depth Information
4.3.6 Salinity
The outlets/inlets at Öresund and Great Belt widened and became deeper until ca.
6 ka BP, resulting in increasing and maximum postglacial salinities (e.g., Westman
suggest that changes in the morphology and depths of the sills in the inlet area only
partly explain the salinity variations during the last ca. 8 ka BP. They found that
a major cause of the salinity changes was variations in the freshwater input to the
basin. The latter study demonstrated that the freshwater supply to the basin may
have been 15-60% lower than at present during the phase of maximum salinity
charge variability may have been an important factor controlling the salinity and the
The eustatic sea level rise ceased sometime between 6 and 5 ka BP. The remain-
ing, though slow, rebound resulted in shallower Öresund and Great Belt straits and
decreased salinities. An estimate of the Baltic basin paleosalinity was presented by
a silicoflagellate to infer different salinity intervals of the last 8 ka. Emeis et al.
carbon isotopes. A comparison of these two salinity reconstructions (Zillén et al.
in salinity from the maximum value between 5 and 6 ka BP, while Emeis et al.
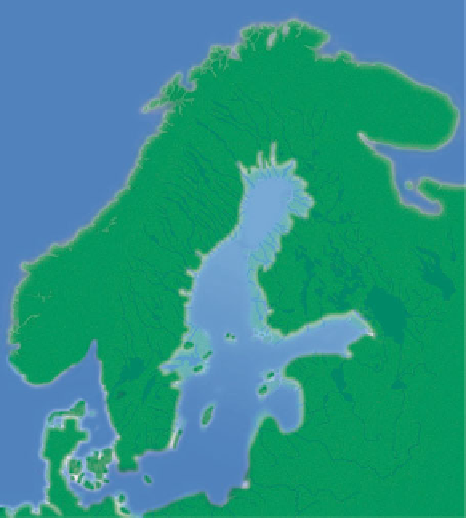
Fig. 4.8
Paleogeographic
map showing the Littorina
Sea during the most saline
phase at ca. 6.5 ka BP