Geoscience Reference
In-Depth Information
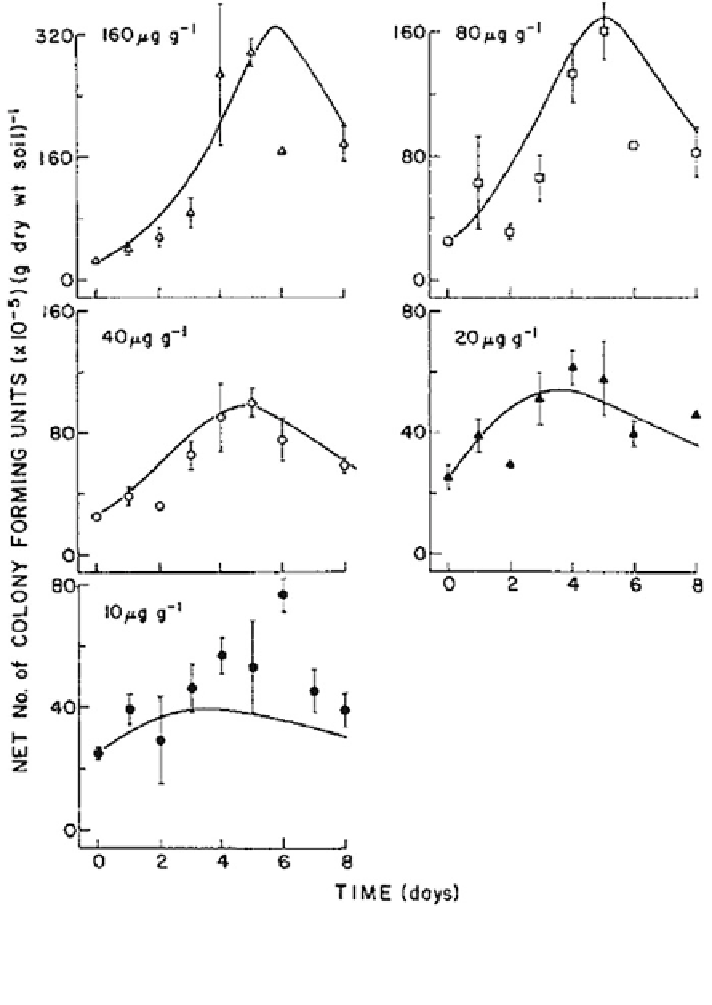
Fig. 16.36 Change in bacteria populations in remoistened Gilat soil after application of
10-160 lg parathion per g dry soil. Plotted points are means of three replicates ± standard error.
Continuous curves represent model simulations. Values obtained in control soils to which hexane
alone was added have been subtracted. Reprinted from Nelson et al. (
1982
). Copyright 1982 with
permission of Elsevier
where t is time in days, P is concentration of diethylthiophosphate (per lg dry
weight soil), m is the number of bacteria (per 10
-5
g dry weight soil), m
o
is the
initial value of m, and Y is the yield of bacteria (lg hydrolysis product formed).
Some hydrolyzing bacteria are present in the soil initially and the equation