Geoscience Reference
In-Depth Information
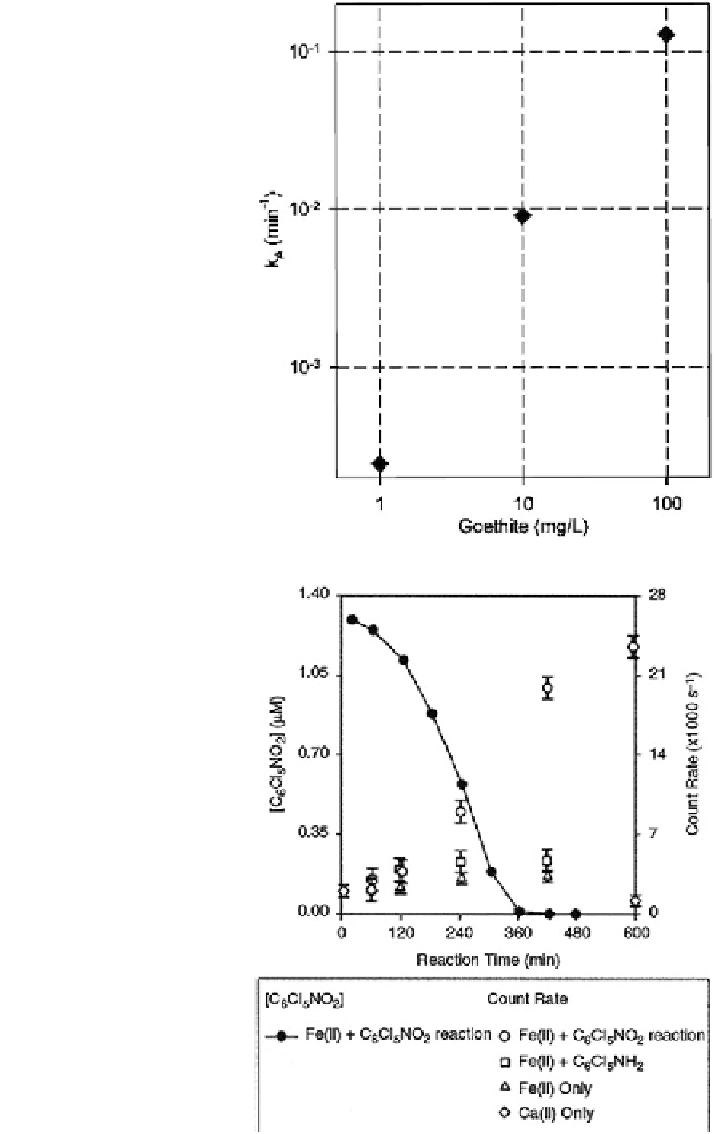
Fig. 16.9 Change in first-
order rate constant (k
A
) for
the reduction of C
6
Cl
5
NO
2
as
a result of varying goethite
content in media with
473 lM Fe(II) and 200 mM
NaCl (pH 6.96). Error bars to
indicate 95 % confidence
intervals would be smaller
than symbols. Reprinted with
permission from Klupinski
et al. (
2004
). Copyright 2004
American Chemical Society
Fig. 16.10 Plot showing
kinetics of C
6
Cl
5
NO
2
reduction (filled circles)
occurring in conjunction with
increasing photon correlation
spectrometry (PCS) count
rates (open circles), which are
indicative of particle
formation, in reaction with
0.80 mM Fe(II) (pH 7.0) (for
clarity, the symbols showing
measured values of
[C
6
Cl
5
NO
2
] are connected
point to point). The other
open symbols show PCS
count rates in nonreaction
mixtures (i.e., without
C
6
Cl
5
NO
2
) containing either
0.80 mM Fe(II) (pH 7.0) or
0.80 mM Ca(II) (pH 7.0).
Reprinted with permission
from Klupinski et al. (
2004
).
Copyright 2004 American
Chemical Society