Geoscience Reference
In-Depth Information
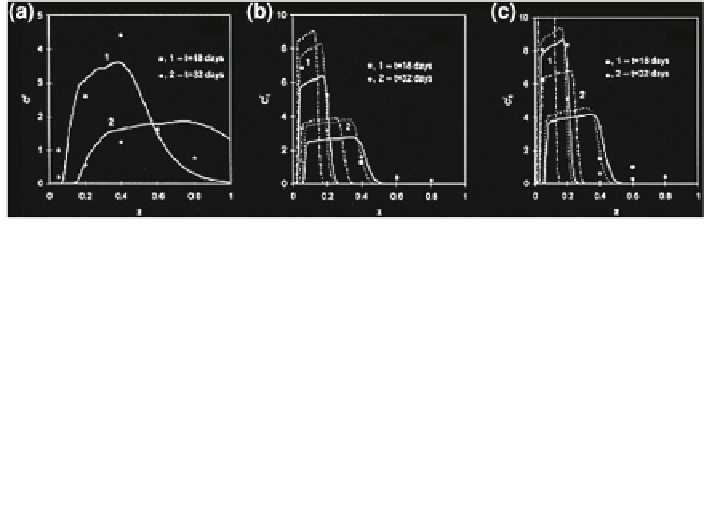
Fig. 12.37 a Calculated (solid curves) and measured (points) mean bromide concentrations,
normalized by the mass of applied solute per unit soil surface, at times t = 18 and 32 days;
b Mean bromacil concentrations, normalized by the mass of applied solute per unit soil surface, at
times t = 18 and 32 days (solid curves best-fit based on least squares of differences between
computed and measured mean concentrations, K
d
= 0.14 mL/g, k = 0.022 days
-1
; dashed
curves based on sum of squares of differences, K
d
= 0.16 mL/g, k = 0.012 days
-1
; dotted-
dashed curves K
d
= 0.24 mL/g, k = 0.022 days
-1
; points measurements); c Mean terbuthyl-
azine concentration, normalized by the mass of applied solute per unit soil surface at times t = 18
and 32 days (solid curves best-fit based on least squares of differences between computed and
measured mean concentrations, K
d
= 0.14 mL/g, k = 0.005 days
-1
; dashed curves based on
sum of squares of differences, K
d
= 0.16 mL/g, k = 0.005 days
-1
; dotted-dashed curves
K
d
= 0.29 mL/g, k = 0.005 days
-1
; points measurements). Reprinted from Indelman et al.
(
1998
). Copyright 1998 with permission of Elsevier
The limitations of both the ADE and MIM formulations were discussed in
developed and applied to such field studies.
Two particular aspects of the transport of degradable contaminants were con-
sidered in laboratory experiments that used soil originating from the field exper-
iments described in the previous sections. Studies on diffusion of degradable
insecticides were performed in diffusion cells, while the spatial redistribution of
pesticides from a point source was measured in specially designed pans (60 cm
high, 40 cm diameter). Periodic sampling and contaminant analysis enabled
visualization of the contaminant transport pathway.
Diffusion of degradable pesticides in a natural soil may be tested against dif-
fusion in the same, biologically inactivated, soil. Gerstl et al. (
1979a
,
b
) investi-
gated diffusion of parathion in a loessial sandy loam soil (Gilat) before and after
''sterilization.'' In the sterilized soil, it was found that the apparent diffusion
coefficient (D) of parathion over a wide range of moisture contents varies between
0.66 9 10
-7
and 3.39 9 10
-7
cm
2
/s. The main factors affecting parathion diffu-
sion in a sterile soil are the adsorption coefficient of the compound on the solid
phase, the moisture content, and the impedance factor (which is determined by the
tortuosity of the porous medium). In the presence of microorganisms, parathion is
degraded as it diffuses in soil.
Figure
12.39
shows an example of parathion distribution in sterilized and
natural, biologically active Gilat soil columns. We see that, at relatively early
times, when the effect of decomposition is minimal, the parathion distribution is