Geoscience Reference
In-Depth Information
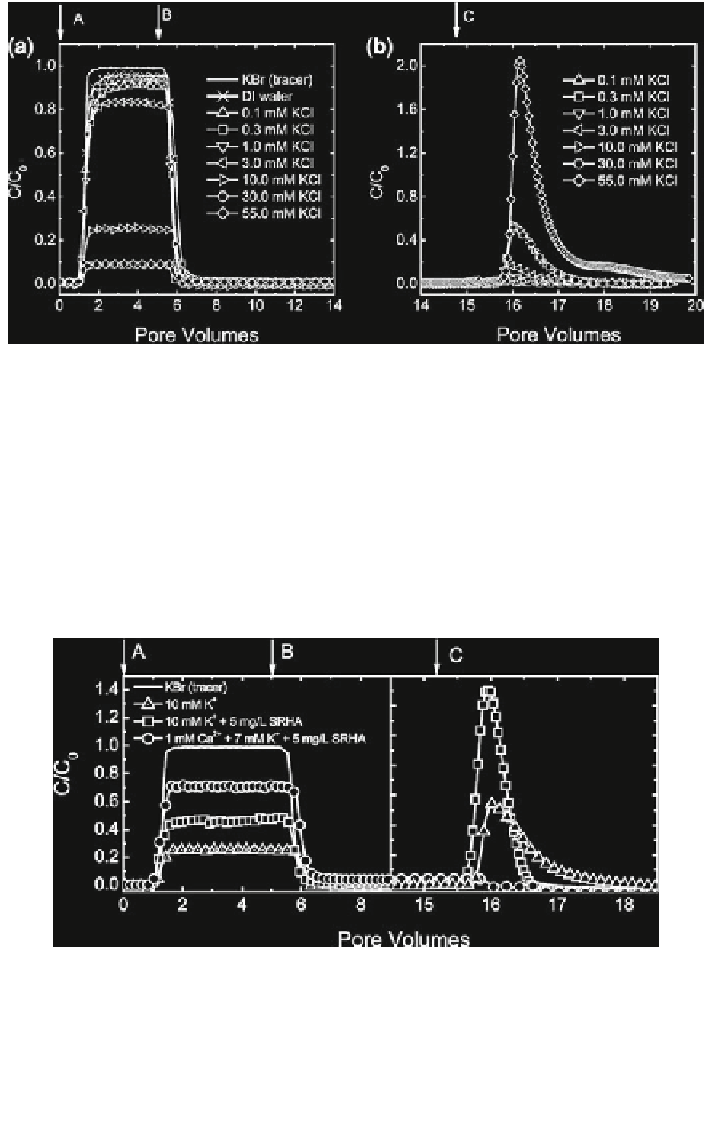
Fig. 12.23 a SWNT breakthrough curves at various KCl concentrations as well as a tracer (KBr)
breakthrough curve. b SWNT release curves following elution with deionized water. Step A
deposition of SWNTs in the packed quartz sand bed at different ionic strengths (KCl) plus
0.1 mM KHCO
3
as a buffer (pH 7.0). Step B elution with the same electrolyte solutions (without
SWNTs). Step C elution with deionized water (pH unadjusted). Experimental conditions are:
SWNT concentration = 87 (±4) mg/L, approach velocity = 0.021 (±0.002) cm/s, packed
column length = 6.3 cm, porosity = 0.37, mean grain diameter = 264 lm, and pH 7.0,
temp. = 23 C (Jaisi et al.
2008
). Reprinted with permission from Jaisi et al. (
2008
). Copyright
2008 American Chemical Society
Fig. 12.24 SWNT breakthrough curves in the presence of 5 mg/L Suwannee River humic acid
(SRHA) presented as normalized SWNT effluent concentration as a function of the number of
pore volumes pumped through the packed quartz sand bed. Humic acid concentration is based on
SRHA dry mass (corresponding to 2.54 mg/L as TOC). The breakthrough curves for a tracer
(KBr) and SWNTs at 10 mM of KCl (with no SRHA) are also included. Column experiments
were carried out at pH 7.0 (adjusted by adding 0.1 mM KHCO
3
as a buffer) (Jaisi et al.
2008
).
Reprinted with permission from Jaisi et al. (
2008
). Copyright 2008 American Chemical Society