Geoscience Reference
In-Depth Information
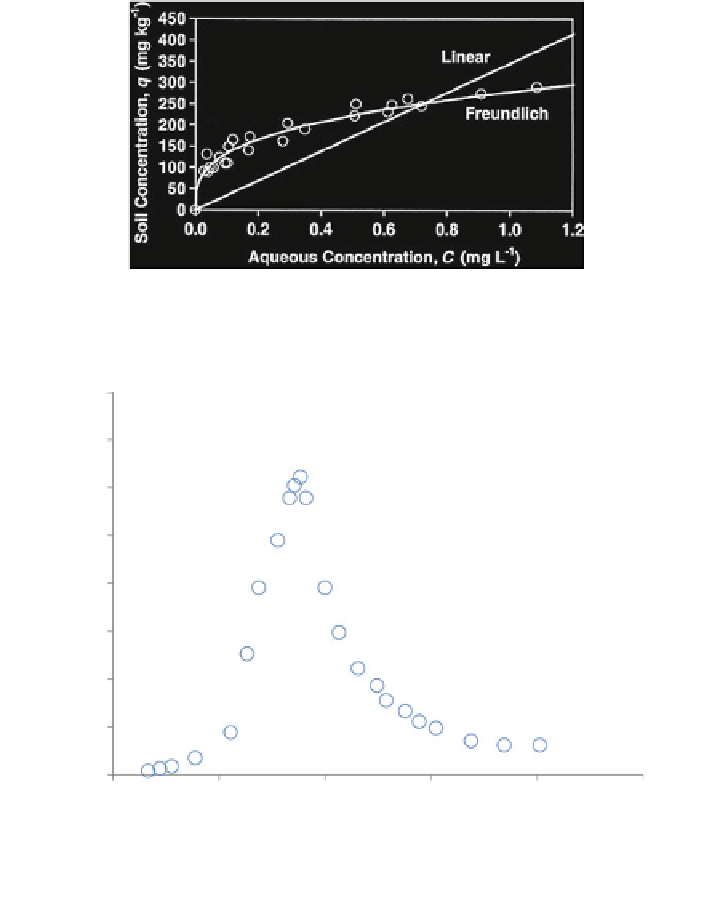
Fig. 12.11 Adsorbed solid versus aqueous As(V) concentration (pH 4.5, 0.01 M NaNO
3
)
(Williams et al.
2003
)
0.8
0.7
0.6
0.5
0.4
0.3
0.2
0.1
0
0
500
1000
1500
2000
2500
Pore Volume (V/V
0
)
Fig. 12.12 Trend of As(V) concentration in the effluents of a soil (sand 31 %, silt 50 %, clay
19 %) column leached with an aqueous solution (pH = 4.5, 0.01 M NaNO
3
,C
0
= 1 mg/L, pore
water velocity = 0.53 cm/min) (Modified after Williams et al.
2003
)
breakthrough curves of As(V) at different initial concentration, in comparison with
that of a nonreactive tracer (Cl
-
), are shown in Fig.
12.13
. Arsenate transport was
significantly retarded with respect to the tracer breakthrough curve. At higher
concentrations, arsenate eluted first but at lower concentrations; the breakthrough
curves exhibit a greater tailing. The nonideal transport of As(V) is explained by the
coupled effect of nonlinear and rate-limited sorption. Yolcubal and Akyol (
2008
)