Geoscience Reference
In-Depth Information
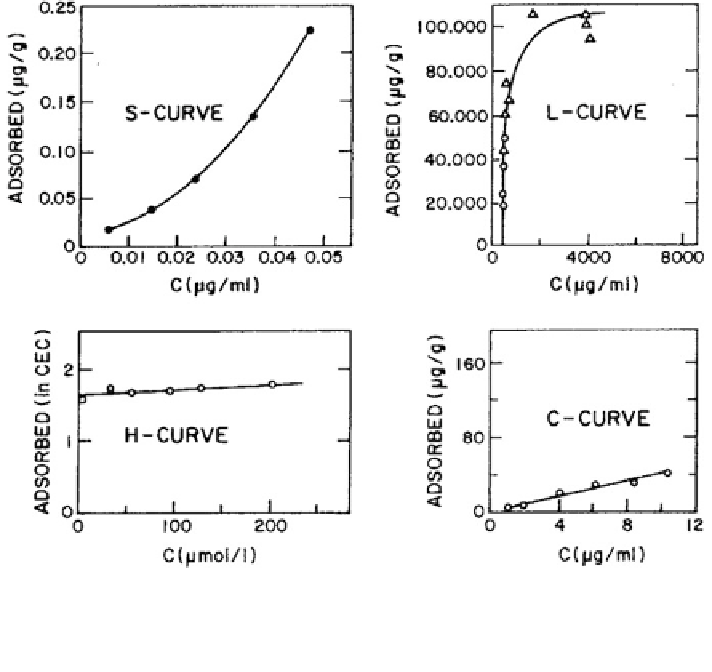
Fig. 5.1 Examples of adsorption isotherms. S-type aldrin on oven-dry kaolinite from aqueous
solution. L-type parathion on oven-dry attapulgite from hexane solution. H-type methylene blue at
pH = 6 on montmorillonite from aqueous solution. C-type parathion on clay soil from hexane
solution (Yaron et al.
1996
)
the adsorbent for the solute at low concentration is less than the affinity of the
solid surface for the solvent.
• The L-curve isotherm is characterized by an initial slope that does not increase
with the concentration of the substance in the solution. This behavior corre-
sponds to high relative affinity of the adsorbent at low concentration and a
decrease in the free adsorbing surface.
• The H-curve isotherm is characterized by a linear increase that remains inde-
pendent of the solute concentration in the solution (i.e., constant partitioning of
the solute between the solvent and the adsorbing surface). This behavior indi-
cates a high affinity of the solid phase for the solvent.
• The C-curve isotherm is similar to the H-curve, being characterized by a linear
increase, but also passing through the origin. This behavior may be due to a
proportional increase in the adsorbing surface as well as to surface accessibility.
Based on their molecular properties as well as the properties of the solvent, each
inorganic or organic contaminant exhibits an adsorption isotherm that corresponds
to one of the isotherm classifications just described. Figure
5.1
illustrates these