Geoscience Reference
In-Depth Information
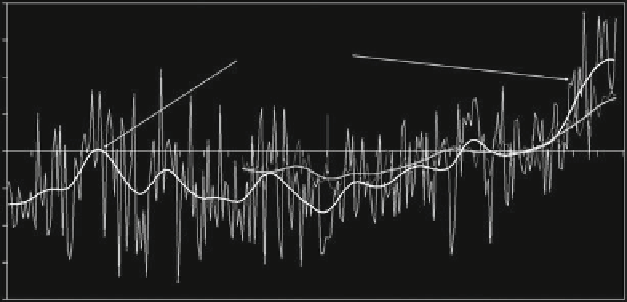
°C
Direct measured temperatures
2.0
1.5
alpine region
1.0
global
0.5
0.0
-0.5
-1.0
-1.5
-2.0
1760
1800
1840
1880
1920
1960
2000
Fig. 3.4
The region of the Alps seems to be particularly susceptible to climatic impacts; the vari-
ance of temperature is more visible in this region than in the global trend. HISTALP (Auer et al.,
2007
; Böhm et al.,
2010
)
not serious to draw conclusions from this single event to an ongoing climate change.
Linked with other extreme events it might be a small part of the “Global Puzzle”.
The damages and losses caused by extreme precipitation events will oblige
responsible authorities to take action so that future events will be less harmful.
3.4 Socioeconomic Development and Rising Disadvantages
We cannot get rid of the feeling that losses caused by natural hazards reaching from
storms to flood events and mass movements are increasing. And yes, it is not just
the nowadays excessive reporting in our “Global Village”, or psychological rea-
soned influences. Looking at world-wide statistics, there is no doubt that there is
an increasing number of natural catastrophes, defined as the region's ability to help
itself clearly overstretched, etc. (Munich Re,
2008
). In 2007, there have been 960
natural catastrophes following this definition, whereas 400 events occurred on aver-
age in the 1980s, 630 in the 1990s, and 730 in the last 10 years. Depending on
the rising number, also the losses of natural catastrophes have increased to US$ 82
billion (Munich Re,
2008
).
The definition of natural catastrophes shown above indicates that socioeconomic
factors are the crucial tasks between hazard and risk (risk
vulnerabil-
ity), although these two terms are often used synonymously. Increasing losses can
be caused by increasing hazards as well as by increasing society's vulnerability
(Fig.
3.5
).
Calculating vulnerability means to determine the number of affected objects
and their resistance against the potential damage. Figure
3.6
shows the increase of
buildings in Austria, from 1951 to 2001 (from 916.448 to 2.047.712 buildings).
=
hazard
×
Search WWH ::

Custom Search