Geoscience Reference
In-Depth Information
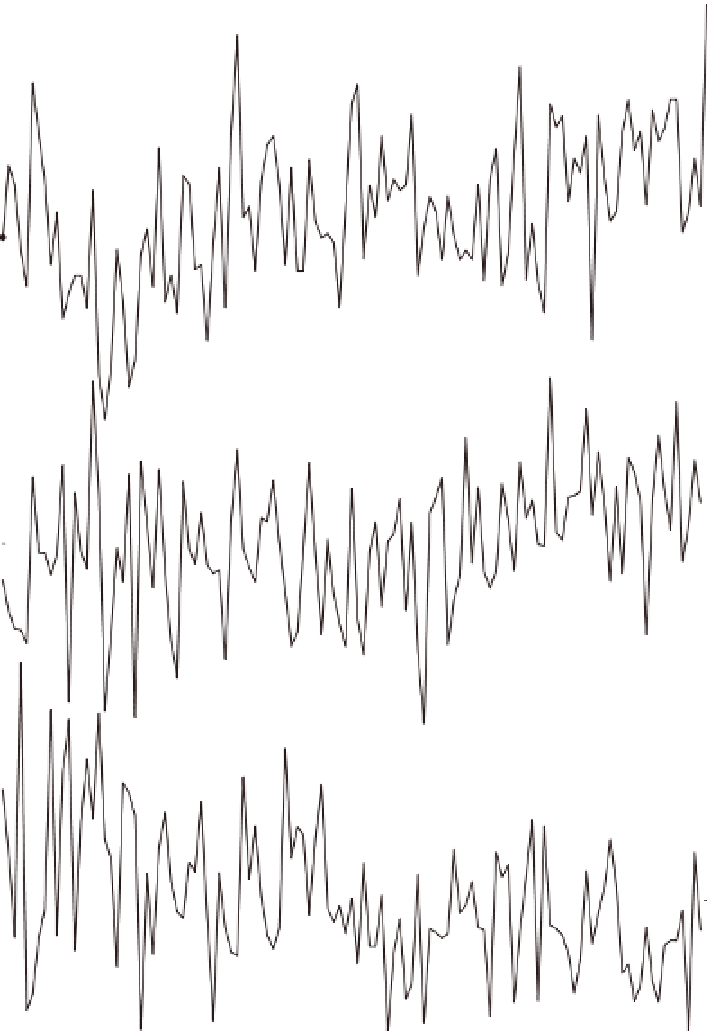
2012
45.6°F
Mean Annual
Temperature
Average
41.7°F
1895
40.9°F
Mean March
Temperature
2012
40.2°F
Average
30.1°F
1895
27.8°F
November - March
Precipitation
1895
0.97 in
/
m
Average
0.72 in/
m
2012
0.65 in
/
m
1895
1905
1915
1925
1935
1945
1955
1965
1975
1985
1995
2005
Year
Fig. 3.9. Summary of historic climate data for Wyoming. the
trends suggest that, during the past two or three decades, the
frequency of unusually warm years and warm March temper-
atures has increased and the amount of winter precipitation
per month has generally declined. the shaded area indicates
±1 standard deviation of the averages for 1895-2012. the
data come from thirty long-time weather stations distrib-
uted throughout the state, all with records starting in 1895,
and were obtained from the national oceanographic and
Atmospheric Administration
(http://www.ncdc.noaa.gov/
cag/).
Adapted from Shuman (2012); supplemented with
recent data.


Search WWH ::

Custom Search