Geoscience Reference
In-Depth Information
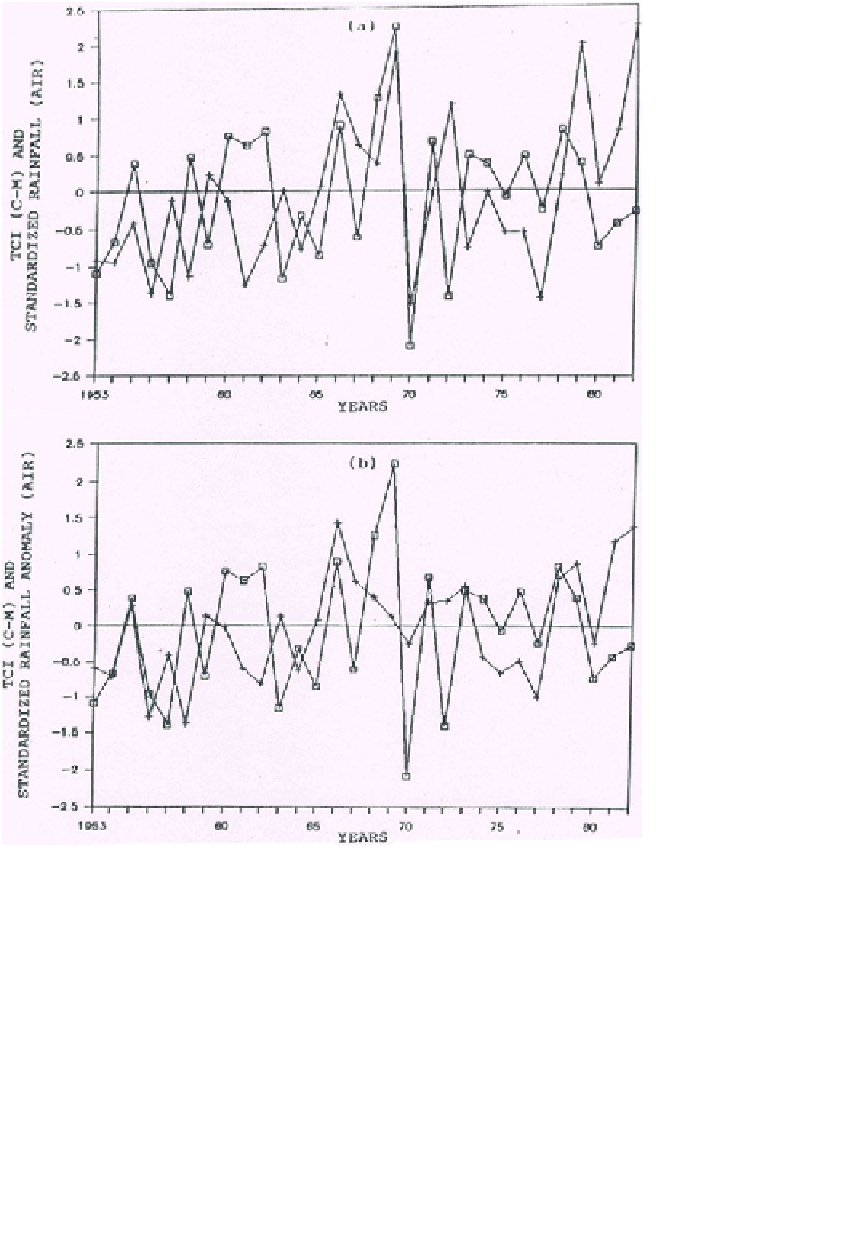
Fig. 1. Time series of standardized rainfall anomaly AIR (marked by square) and TCI
(C-M) of concurrent (a) August (marked by plus) and (b) JJA (marked by plus).
CCs are also obtained between concurrent June and July TCI (C-N) and
AIR (CC =
0.42 at 2% level and
0.37 at 5% level), and with NWR
−
−
(CC =
0.38), both significant at 5% level. Concurrent June TCI
(C-N) and PIR show CC of
0.37 and
−
−
0.44 at 2% level, while succeeding November,
December, SON, and DJF show significant and negative CCs of
−
0.56
−