Geoscience Reference
In-Depth Information
reanalysis it mainly appears in the land region. In the northwestern Pacific
region to east of Philippines, the AIRS observations show an independent
maximum, but this does not occur in the NCEP/NCAR reanalysis. The
results from AIRS observations also show a remarkable sub-seasonal change
with decrease of the humidity from early to late May, consistent with
a low-level moisture loss associated with a development of the strong
convection activities in the SCS. However, this feature does not appear
in the NCEP/NCAR reanalysis.
The 3D structure and evolution characteristics of the water vapor
during the SCSSM onset have not been well documented. Figure 2 depicts
the vertical distributions of the humidity, the QuiSCAT surface wind, and
TMI precipitation averaged between 105
◦
E-120
◦
E in early, middle, and late
May in 2003, 2004, and 2005, respectively. We did not discuss the case of
2006 simply because the onset of SCSSM in 2006 is strongly controlled by
the circulation associated with Typhoon CHANCHU in middle May.
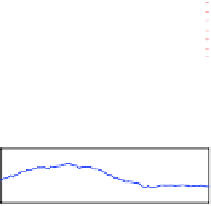
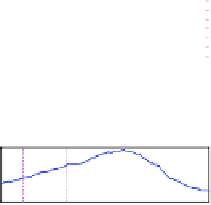
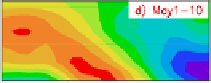
Fig. 2. The vertical-latitude distributions of the 10-day mean AIRS humidity at
1000 hPa (shading, scales are shown in the bar in unit of g/kg), QuiSCAT surface zonal
wind (blue line,
Y
-coordinate scales are marked in right side in unit of m/s) and TMI rain
rate (red line,
Y
-coordinate scales are marked in left side in unit of mm/day) averaged
between 105
◦
E and 120
◦
E. For the humidity,
Y
-coordinate shows the pressure level (hPa)
and the domain average over 105
◦
E-120
◦
Eandeq.-20
◦
N is removed at each pressure
level.