Geoscience Reference
In-Depth Information
September 21, 2006. The atmospheric boundary layer and cloud were
captured at the altitude of 2 km and 4 km, respectively. The structure
was stable and showed little change till 9:00, while the relatively large
echo appeared and raised its altitude from the ground during 9-12 h. In
accordance with the change, cloud appeared at the altitude of 1.5-2 km.
This condition continued till 16:00. Figure 4(b) shows the result observed
during 0-12 h on December 23, 2006. The cloud appeared at the altitude
of 6 km and lowered its altitude gradually from 0 to 6 h. Another cloud
appeared on the boundary layer at the altitude of 1.5 km starting from 6:00.
The boundary layer reduced the altitude down to 0.3-0.5 km. Furthermore
during 8-10 h, another cloud appeared on the lowered boundary layer.
Obviously, those results demonstrate the benefit of long-term observation.
The change in temperature, wind, and the local-climatological influence of
the site location will also be reflected in the observation data.
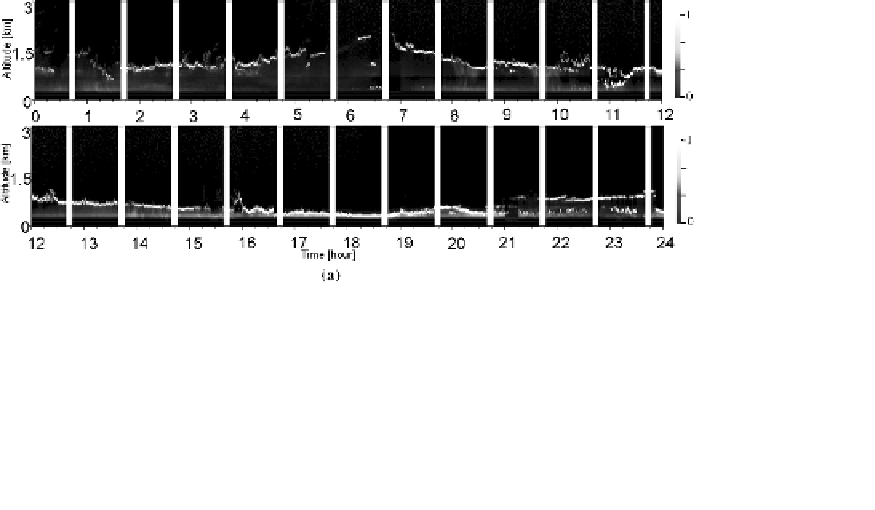
The result of temporal and horizontal-scanning observations on July 2,
2007 is shown in Fig. 5. On the day, the cloudy weather from the preceding
day gradually worsened and started to rain in the evening. Time-height
indication result of Fig. 5(a) shows that cloud moved slowly in the altitude
range of 1-1.5 km during 0-8 h. The cloud altitude lowered in 8-12 h, while
another thin echo appeared under the cloud layer. It rained in 15-19 h
(Chiba city).
Temperature-humidity variation shown in Fig. 5(c) and pressure-wind
speed variation in Fig. 5(d) also indicate the same change in the atmosphere
activity, particularly the change of humidity in 0-12 h and 15-19 h, and
the change of pressure/wind speed in 15-19 h. The spatial distributions of
Fig. 5. (a) 24-h long-term observation result (b) 24-h horizontal scanning result
(c) temperature and humidity (d) pressure and wind speed data: 2 July, 2007.