Geoscience Reference
In-Depth Information
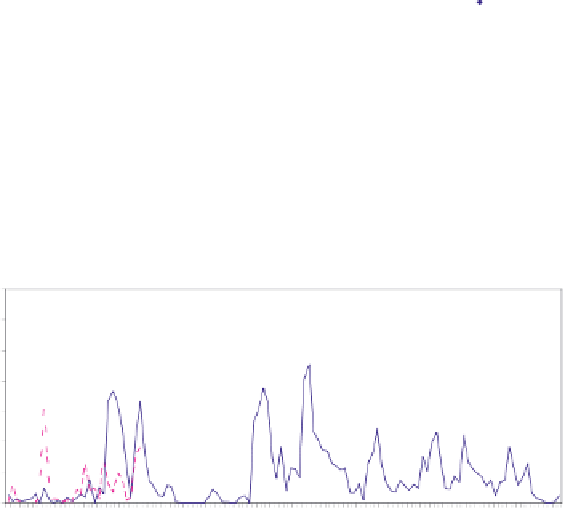
stations of TMD which had complete data in May and June, 1997 and
1999. The time series of area-averaged daily total rainfall in six regions
are compared with the observed value. The comparison is shown in
Figs. 3(a)-3(f) for Northern, Northeastern, Central, Eastern, east coast
Northern Thailand
70
Simulation
Observation
(a)
60
50
40
30
20
10
0
May, 1997
June, 1997
May, 1999
June, 1999
Day
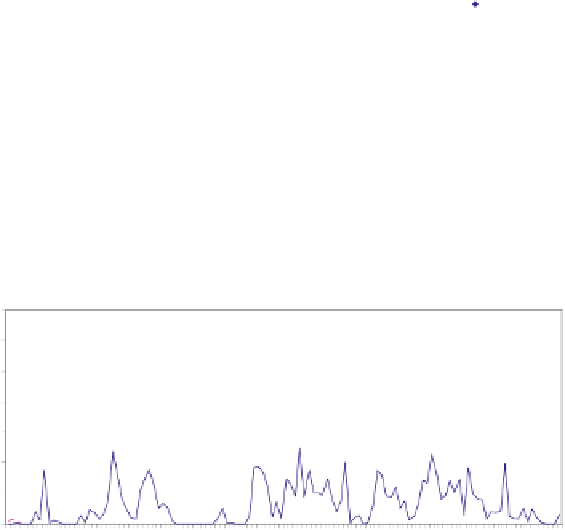
Northeastern Thailand
70
Simulation
Observation
(b)
60
50
40
30
20
10
0
May, 1997
June, 1997
May, 1999
June, 1999
Day
Central Thailand
70
Simulation
Observation
(c)
60
50
40
30
20
10
0
May, 1997
June, 1997
May, 1999
June, 1999
Day
Fig. 3. The observed (dashed) and simulated (solid) area-averaged daily rainfall in
4 months for the six regions of Thailand.