Geoscience Reference
In-Depth Information
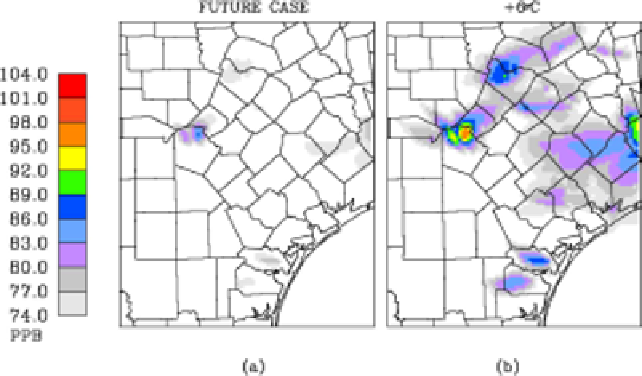
Fig. 5.
Spatial pattern of ozone exceedances
>
74 ppb.
ozone exceedances become considerably more pronounced and widespread
for levels greater than 74 ppb throughout the NNA domain, as shown
in Fig. 5. The magnitude of surface ozone concentrations is once again
highest in the San Antonio region, although ozone exceedances tend to be
more prevalent in Austin, as shown in Table 5. The dependence of ozone
formationonitsprecursorsisnonlinear as described by Lin
,
17
and
hence the ozone formation in each urban region is dependent on the VOC/
NOx concentration ratios in the atmosphere. The ozone formation and
destruction can occur in regions far away from their sources of emissions.
Furthermore, an analysis of the number of grid cells or area impacted
by the 8-h ozone exceedances with rising temperature perturbations was
undertaken. As shown in Table 5, for the first 2
◦
C temperature augmenta-
tion there is a substantial increase of area with exceedances relative to
the base case for the major portion of the 4 km domain. Thereafter, with
each degree rise in temperature, the percent increase in area with 8-h
ozone exceedances relative to the immediately preceding perturbation case
declines, reinforcing the fact that certain portions of the modeling domain
are more affected than others by temperature perturbations. As expected,
the spatial extent of ozone exceedances increases significantly in compari-
son to the base case with rising temperatures as shown in Tables 4 and 5.
Table 4 portrays the fact that amongst the NNA regions, the San
Antonio counties are the only area impacted by the 8-h ozone exceedances
et al.