Geoscience Reference
In-Depth Information
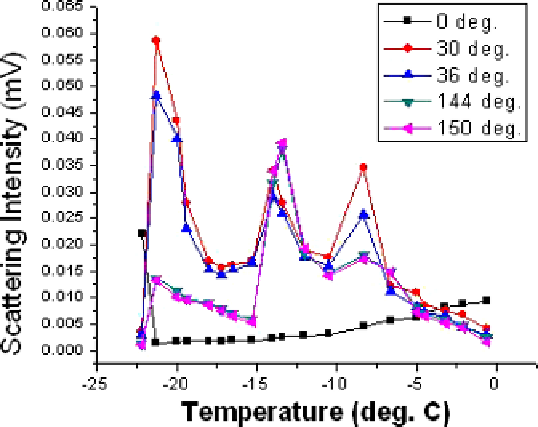
Fig. 5.
Variation of scattering intensity at different angles against seeding temperature.
and 36
◦
are of the order of mJ/m, whereas, in general, the corresponding
intensities at 144
◦
and 150
◦
are one or two orders less. The temperature
variation of maximum scattered intensity at different seeding angles is
presented in Fig. 5. All these values are the mean of four observations.
The direct intensity sharply falls as the seeding temperature increases from
−
21
◦
C, and then it shows a slow rise as the temperature rises.
This is understandable, as below
22
◦
Cto
−
21
◦
C, the crystals are quite insignificant
in number as well as size. As the crystal number and modal dimension show
an overall gradual fall with a rise in temperature beyond
−
21
◦
C, the direct
−
intensity also slowly rises.
In case of scattered intensity, there are three distinct peaks in forward-
scattering intensity (at 30
◦
and 36
◦
)at
−
21
◦
C, close to
−
14
◦
C, and
−
8
◦
C.
14
◦
C are understandable, as both the
crystal number and modal dimension show peak at those temperatures.
The highest peak naturally occurs at
−
21
◦
Candcloseto
−
The peaks at
21
◦
C. But, the justification for the
peak in forward-scattering intensity at
−
8
◦
C is unclear.
In case of backward-scattering intensity (at 144
◦
and 150
◦
), the highest
peak occurs at
−
13
◦
Cisevengreater
than the forward-scattering intensity at the corresponding temperature.
Nonspherical ice crystals are known to produce various features like corona
13
◦
C. The backward-scattering at
−
−