Geoscience Reference
In-Depth Information
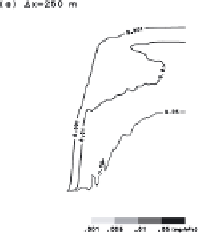
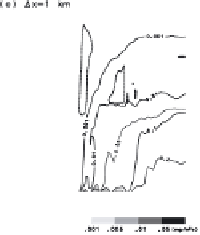
Fig. 4. The same as Fig. 3, except for the cases with ∆
x
of (a) 250 m, (b) 500 m,
(c) 1km, (d) 2km, and (e) 4km.
Figure 4 shows the temporal and height variation of dust concentration,
upward flux of dust, and cloud boundary for the cases with various grid
spacings. The diurnal features found in the control simulation can also be
seen for the cases with the coarser grids except the 4-km grid case in which
a later but more sudden development of upward dust flux is seen. In the
coarsest grid case, the unexpectedly sudden and intense cumulus convection
during 1400-1500 LT resulted in the highest value of column integrated dust
content among all the cases examined here. The column dust contents at
the end of the simulation period for the control and the 500-m grid runs
are 0.63 g m
−
2
and 0.80gm
−
2
, respectively, while the content for the 4-km
run is 1.1 g m
−
2
. It should be noted that the column content obtained by
the control run is consistent with the estimation by satellite remote-sensing
data.
20
The resolution-dependence is further demonstrated by examining the
difference of boundary-layer development. The PBL activity is diagnosed in
terms of TKE that is computed in the SGS turbulence closure scheme.
14, 19
Figure 5 compares the diurnal variation of the boundary-layer development
for the cases with ∆
x
= 250 m, 1 km, and 4 km. In the 250-m grid case,
the PBL motion starts to intensify at 0900 LT, and the boundary layer