Geoscience Reference
In-Depth Information
3. Results
3.1
. High-resolution simulation
The results of the control simulation are demonstrated as a reference for
the sensitivity experiments.
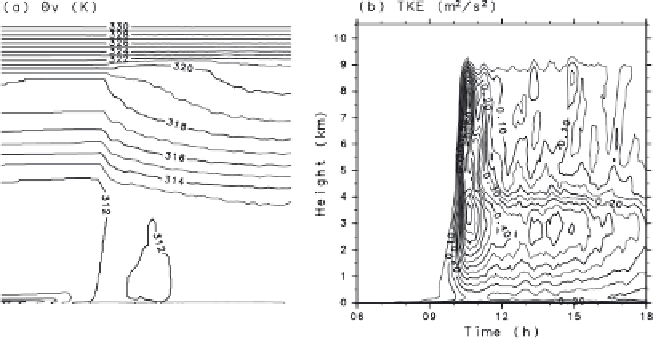
Figure 2 shows the diurnal variation of the atmosphere in terms of
stability and turbulence intensity. Virtual potential temperature and tur-
bulent kinetic energy (TKE) are horizontally averaged over a computational
area. The initial atmosphere has a strongly stable surface layer capped with
a neutral layer (which is a residual of the previous daytime PBL); this initial
stable layer is eroded by surface heating and disappears before 0900 LT.
The turbulent intensity gradually increases from the surface, which leads to
the formation of convective mixed layer. At 1000 LT, the top of the mixed
layer reaches a height above 4 km and then deep convective clouds develop
above the mixed layer. In the afternoon, the PBL convection remains to be
strong, and deep convective clouds sporadically develop.
The diurnal variation of dust transport associated with the shallow
and the deep convection is indicated in Fig. 3. Surface emission starts at
1000 LT when deep convective activity is intensified. The emitted dust
is immediately raised within the PBL; the development of the dust layer
agrees well with that of the layer with high TKE, which suggests that at
Fig. 2. Time-height section of horizontally averaged (a) virtual potential temperature
(contoured at 1-K interval) and (b) turbulent kinetic energy (contoured at 0.05-m
2
s
−
2
interval). A cloud region defined as having cloud water plus ice mixing ratio of 0.025-
0.05 g kg
−
1
(lightly shaded) and greater than 0.05 g kg
−
1
(darkly shaded) is indicated in (a).