Geoscience Reference
In-Depth Information
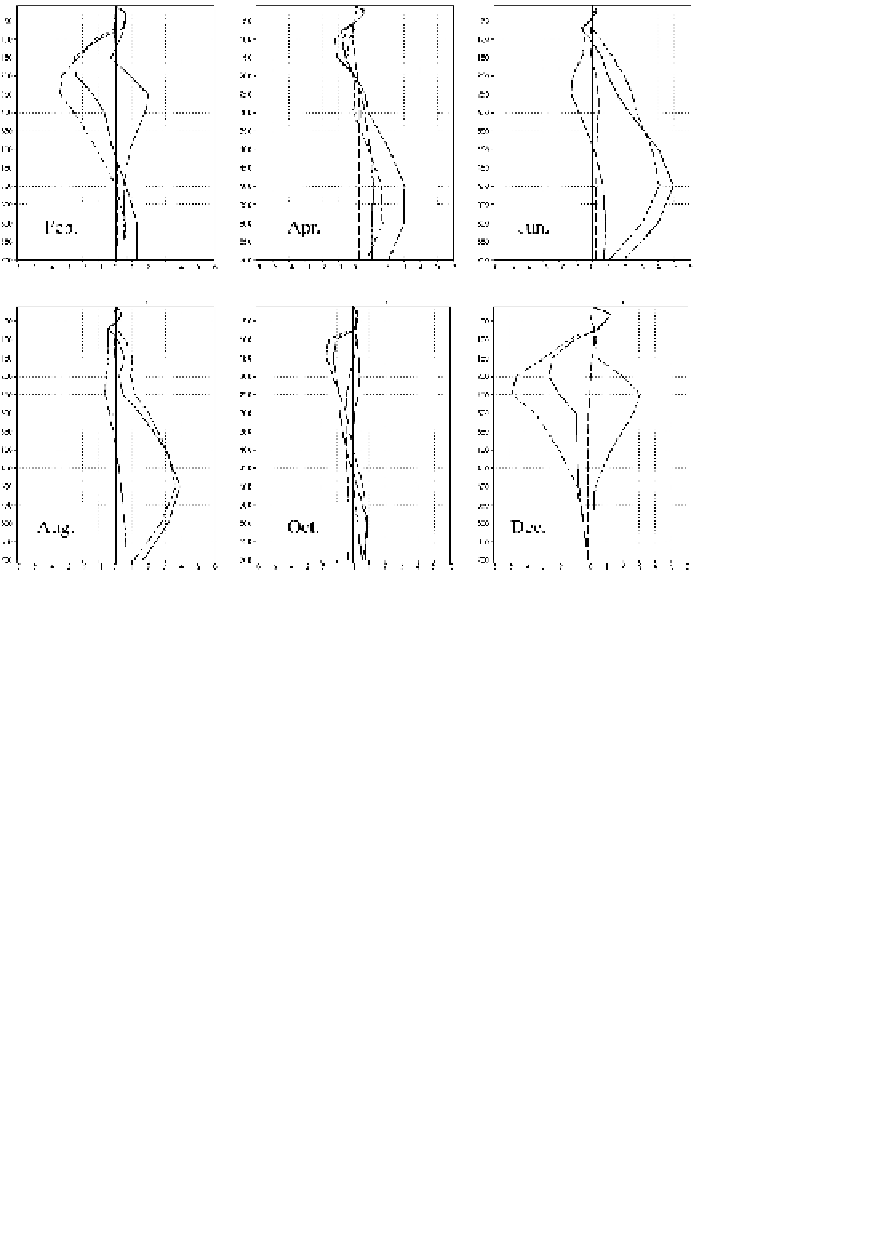
Fig. 2. The vertical profile of monthly mean
Q
1
and its components at 3000 m level
over the QTP, with solid line for
Q
1
, long dashed for the local term, dotted line for the
advection term, and dash dotted for the vertical transport term (Units: K day
−
1
).
vice versa. As indicated by the vertical profile, the “piston” reaches its top
in July-August when the heat source is the deepest. Conversely, as the
“piston” has its lowest position, the cold source covers the greatest depth
in October-December, and the troposphere is nearly under the control of
the cold source.
The strongest heat source layer occurs almost at 500-600 hPa, except
for its intensity that peaks in June and decreases toward January and
December (as shown in Fig. 3), with the cold source dominating practically
all atmospheric levels in December. Note that the height and vigor of the
maximal cold source layer change with time. In June-August, the cold
source layer is weak in intensity and shallow in depth, reaching its greatest
thickness in cold months (NDJ), with its highest strength at 200 hPa.
The vertical profiles of monthly
Q
1
and its components (Fig. 2)
show that the height-dependent local term value is considerably smaller