Geoscience Reference
In-Depth Information
(a)
(b)
Frequency
Frequency
Susceptible
Resistant
Extreme
white lines
Extreme
yellow lines
Disease
score
DNA
extractions
Flour
colour
score
Bulk 1
Bulk 2
Bulk 1
Bulk 2
(c)
P
1
P
2
B
1
B
2
P
1
P
2
B
1
B
2
P
1
P
2
B
1
B
2
P
1
P
2
B
1
B
2
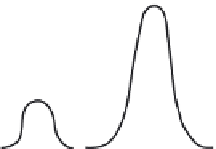
FIGURe 17.6
The preparation of DNA bulks for a simple disease resistance trait
(a) and a quantitative quality trait (flower colour) (b). In both cases, two bulks
(B1 and B2) are made from individuals displaying extreme phenotypic scores. (c)
Polymorphic markers (indicated by arrows) that are identified between bulks may
represent markers that are linked to genes or qTLs controlling the traits. Such
markers are then used to genotype the entire mapping population and qTL analy-
sis performed. (Adapted from Tanksley et al., 1995.
Trends in Genetics
, 11, 63- 68.)
1994). 'High-volume' or 'high-throughput' marker techniques
(e.g. RAPD or AFLP) are generally preferred for BSA that can
generate multiple markers from a single DNA preparation.
The selective individuals representing the phenotypic
extremes or trials of the trait being analysed is known as selec-
tive genotyping (Foolad and Jones 1993; Lander and Botstein
1989; Zhang et al. 2003). Individuals with phenotypic extreme
are only used for the linkage map construction and QTL analy-
sis. The method of selective genotyping is generally used when
phenotyping is costlier or if there are many individuals in the
population. The main drawback of this method is that only one
trait can be tested at a time because the individuals selected for
extreme phenotypic values will usually not represent extreme