Geoscience Reference
In-Depth Information
1
2
3
4
5
A
O
U
J
E
5.9
9.8
11.2
12.9
F
16.8
K
9.7
P
V
B
G
14.9
10.7
11.8
Q
20.4
14.4
W
L
8.6
H
9.0
C
13.8
R
X
11.5
17.5
M
13.3
7.4
D
Y
10.5
S
I
N
10.1
10.6
T
Z
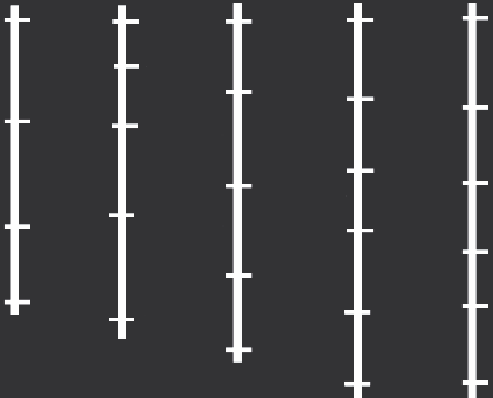
FIGURe 17.3
Hypothetical 'framework' linkage map of five
chromosomes (represented by linkage groups) and 26 mark-
ers. Ideally, a framework map should consist of evenly spaced
markers for subsequent qTL analysis. If possible, the frame-
work map should also consist of anchor markers that are
present in several maps, so that they can be used to compare
regions between maps. (From Collard, B. C. Y., Jahufer, M. Z.
Z., Brouwer, J. B., and Pang, E. C. K. 2005.
Euphytica
, 142(1-2),
169-196.)
apply for the map distance that is greater than 10 cM. There are
two commonly used mapping functions:
1. Kosambi mapping function, which assumes that recom-
bination events influence the occurrence of adjacent
recombination events, that is, partial interference, and
measured as (
4
)ln[(1 + 2θ)/(1 − 2θ)].
2. Haldane mapping function, which assumes no inter-
ference between crossover events. Haldane's mapping
function is based on the Poisson distribution of the num-
ber crossing over, so that the genetic distance (m) and
observed recombination fraction (θ) containing an odd
number of crossover is
m
= −ln (1 − 2θ)/2 (Kearsey and
Pooni 1996; Paterson 1996; Hartl and Jones 2001).
It should be noted that the distance between genetic
markers depends on the genome size of the plant species. It
is not related to physical distance of DNA between genetic