Geoscience Reference
In-Depth Information
5
0
-5
1950
1960
1970
1980
Time
1990
2000
2010
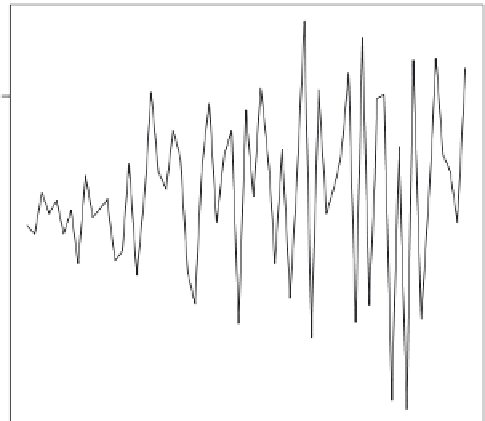
FIGURe 4.3
Graphical representation of stationary data.
p
1.0
0.8
0.6
0.4
0.2
0.0
-0.2
-0.4
0
5
10
15
Lag
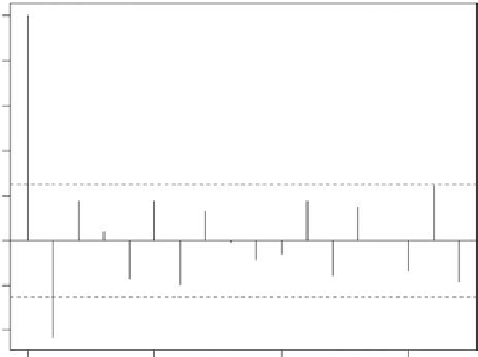
FIGURe 4.4
Auto-correlation function (ACF).