Geoscience Reference
In-Depth Information
1400
1350
1300
1250
1200
1150
1100
1050
1000
90
80
70
60
50
40
30
20
10
0
Ye ars
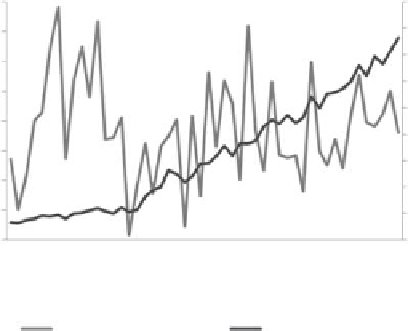
To tal annual rainfall
Wheat production
FIGURe 4.1
(
See colour insert.
) Trend in total annual rainfall
(mm) and production (million tonnes) of wheat over years.
systems on marginal land. Table 4.1 gives the total annual rain-
fall (mm) along with the total production (million tonnes) of
wheat in India from 1950 to 1999. It can be seen from Figure 4.1
that the trend in total annual rainfall (mm) and production (mil-
lion tonnes) of wheat over years are not similar. However, the
state-wise data may depict some strong relation between annual
rainfall and production.
Probability distributions consist of mutually exclusive and
exhaustive compilation of all random events that can occur for a
particular process and the probability of each event's occurring.
It is a mathematical model that represents the distributions of the
universe obtained either from a theoretical population or from
the actual world; the distribution shows the results we would
obtain if we took many probability samples and computed the
statistics for each sample. Some well-known probability distri-
butions are uniform distribution, binomial distribution, Poisson
distribution, normal distribution, exponential distribution and
so on. Fitting these distributions to the data provides some idea
regarding the distributional pattern.
4.2
Relationship studies
Climate is a paradigm of a complex system. It has many vari-
ables, which act on a wide range of space-time scales. Statistical
tools can be employed for studying the relationship between
these variables. Some of such tools are discussed as follows.