Geoscience Reference
In-Depth Information
120
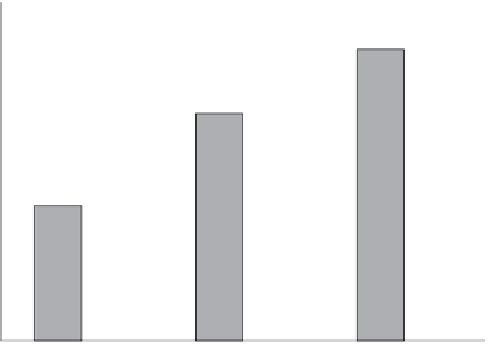
Simulated
Observed
100
80
60
40
20
0
PI
Flowering
Maturity
5th July transplanting
FIGURe 3.6
CERES-Rice model for yield prediction in kg/ha
at different phenophases.
crop development, growth and yield. Ultimately, the breeders
can anticipate future requirements based on the climate change.
Improved quantitative models for forecasting regional pro-
ductivity with the various factors will be crucial for evaluating
trade-offs associated with potential changes. As optimum crop
production estimation becomes more complex, involving several
factors such as fertiliser, pest control, genotype, environment and
cultural practices, conducting trials with various combinations
of these factors becomes very complex and expensive. The influ-
ence of soil, water and climatic variables on rice productivity can
be effectively estimated through different rice models. The use of
rice crop models is very important for suggesting best manage-
ment practices, forecasting yields, pest and disease incidences,
suitable varieties and best sowing dates for optimum crop pro-
duction with variable climatic conditions. The days taken by rice
crop for panicle initiation, flowering and maturity were simulated
and compared with observed values. It was found that the model
fairly simulated the days taken as shown in Figure 3.6.
3.5
Crop simulation model and agricultural
production
Generally, the relation of weather factors with the growth
and development of a crop is expressed by an equation that is