Geoscience Reference
In-Depth Information
graph (a), the climate sensitivity to a doubling of CO
2
is still only 1.3°C, and
falls outside the IPCC's likely range (1.5°C
- 4.5°C). Could the hockey stick
curve be less convincing than it first appears?
Fortunately, exemplary
cherry picking
helps to restore conclusions
which comply better with the IPCC's assumptions: by limiting
the adjustment period to 1975-2000, a climate sensitivity of 3.1
°
C to a
doubling of CO
2
can be obtained, and a warming rate of 0.2°C per decade
(Figure 3.5).
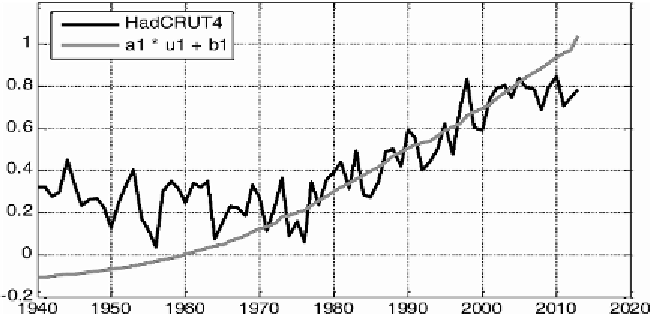
Figure 3.5.
Adjustment optimized over the period 1975-1998
The decline before 1975, as well as the plateau emerging at the start of
the 21
st
Century should however encourage a note of caution before setting
alarm bells ringing.
Following the same train of thought, inconsistent conclusions
can be drawn from Figure 3.4 (b). In particular, even at the scale of the
figure, an eventual divergence can be seen between the two lines. This is
even clearer in Figure 3.6 below, where Stauning [STA 11] corrects and
expands a graph by Friis-Christiensen [FRI 91], previously limited to the
period 1850-1985.


Search WWH ::

Custom Search