Geoscience Reference
In-Depth Information
0.8
HadCRUT4
Moberg
Ljungqvist
Loehle
Jones-Mann
0.6
0.4
0.2
0
-0.2
-0.4
0
500
1000
1500
2000
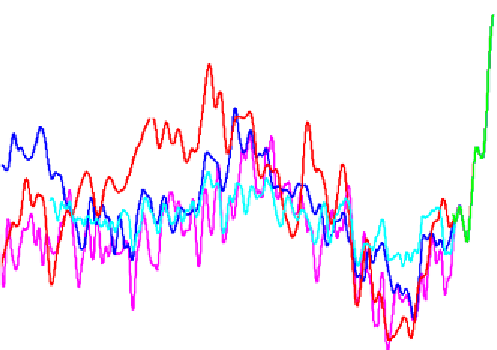
Figure 2.3.
Four temperature reconstructions, collated in HadCRUT4
In order to obtain a set of single piece data we spliced them with the
global temperature HadCRUT4, from 1850, after alignment by equalizing
the average values over the overlap period. This was done without
recalibration, maintaining the original scaling factors, as shown in Figure
2.4. It can be seen that the quality of the reproduction of thermometric
temperatures by reconstructions is far from perfect.
Some of these reconstructions are supposed to be global, others are
limited to continents or to the northern hemisphere. However, they are all
linked without distinction to the same global temperature (HadCRUT4),
since uncertainty caused by proxies appears to be greater than the differences
that can be seen over the historic period, between continents and oceans, or
between the northern and southern hemispheres.
The overall view of these curves (Figure 2.3), over more than a
millennium, confirms that they come from the same climatic history, and
that the frequent concordance in their variations is not down to chance.
However, it can be noted that the relationship with the high temperature


Search WWH ::

Custom Search