Geoscience Reference
In-Depth Information
the same results
3
, without knowing anything about the future evolution of
the climate. Of course, no one would have given the slightest credence to
predictions so far from the simple visual extrapolation of the warming
observed until 1999.
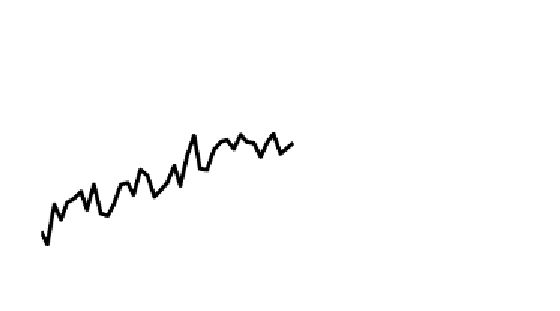
HadCRUT4
Predictions
Tr end ( 1975- 2000)
1.5
1
0.5
0
1980
1990
2000
2010
2020
2030
2040
2050
Figure 11.6.
Retroactive predictions
We would highlight that, even with short-term predictions, they are based
on models determined from data which covers more than a millennium. The
deviations between the predictions for 2050 echo the deviations between the
paleoclimatic data around the year 1000! In 2014, following the arrival of
the climate pause, we were happily surprised to see the lines in Figure 11.6
appear as they do. One might have feared some disturbing effect of internal
variability, and that the results are rather inconclusive. With
a posteriori
predictions in such close accordance with reality, we naively pondered how
our own algorithm had done such a good job in reproducing these
observations post-2000, without any prior knowledge. On reflection, the
algorithm was able to express the combination of the following range of
factors:
1) The turn-around in average solar activity had started long before
(Figure 2.7), but its effect is only now being fully appreciated, due to
climatic time constants;
2) Solar cycles reach minimum levels, during the decade 2002-2012;
3 Supposing paleoclimatic reconstructions were available at that time.


Search WWH ::

Custom Search