Geoscience Reference
In-Depth Information
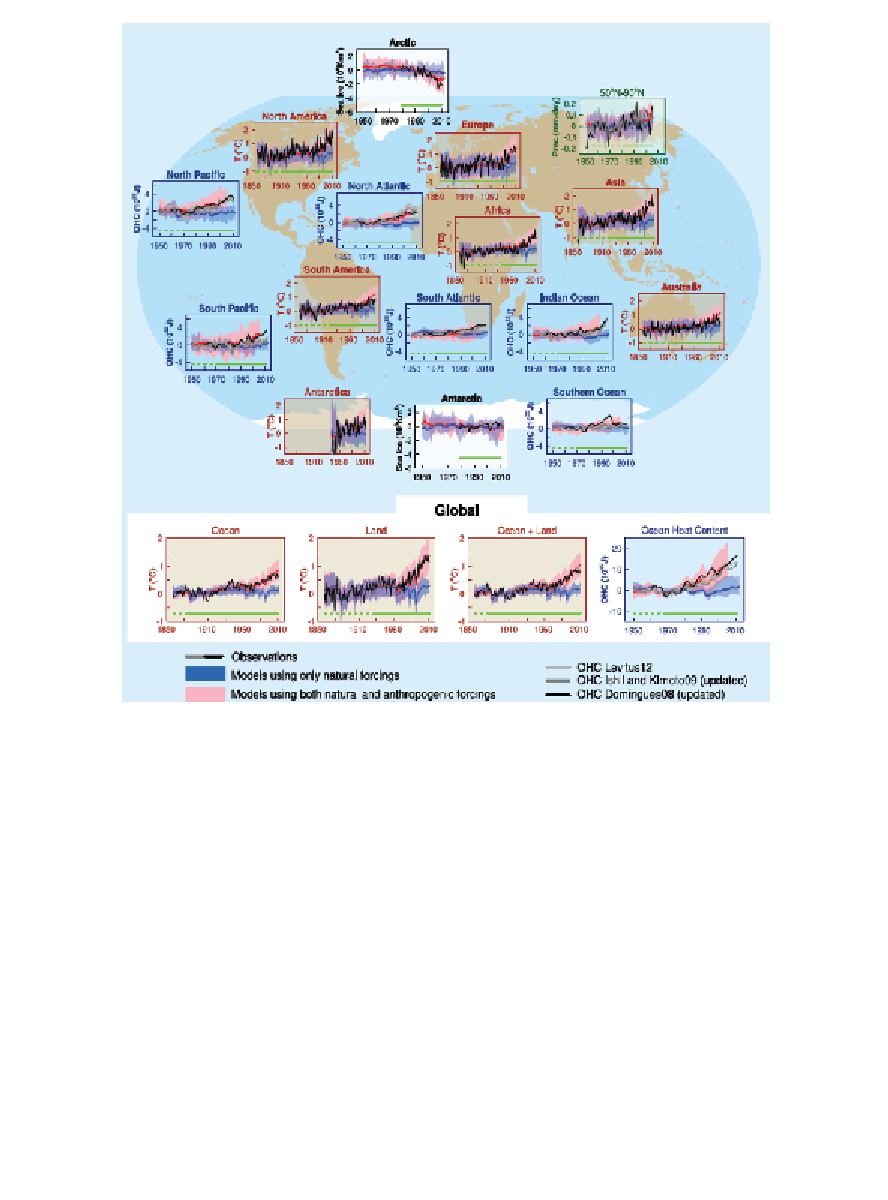
Figure 9.1.
IPCC simulations
9.2. Comparative simulations
We are only interested in global temperature. Figure 9.2 therefore takes
the “Ocean + Land” graph from Figure 9.1.
Figure 9.3 below shows the averages of the simulations, taken from all of
our freely identified models, using all of the combinations in our catalogue
of climatic data, without excluding the reconstructions of both Jones and
Mann, and Loehle. This figure arises from the entirety of the data without
any kind of external intervention.

Search WWH ::

Custom Search