Geoscience Reference
In-Depth Information
The follow-up of position and dispersion indicators over time are also simple
ways to identify changes in the organization of a spatial system. Two examples are
given here:
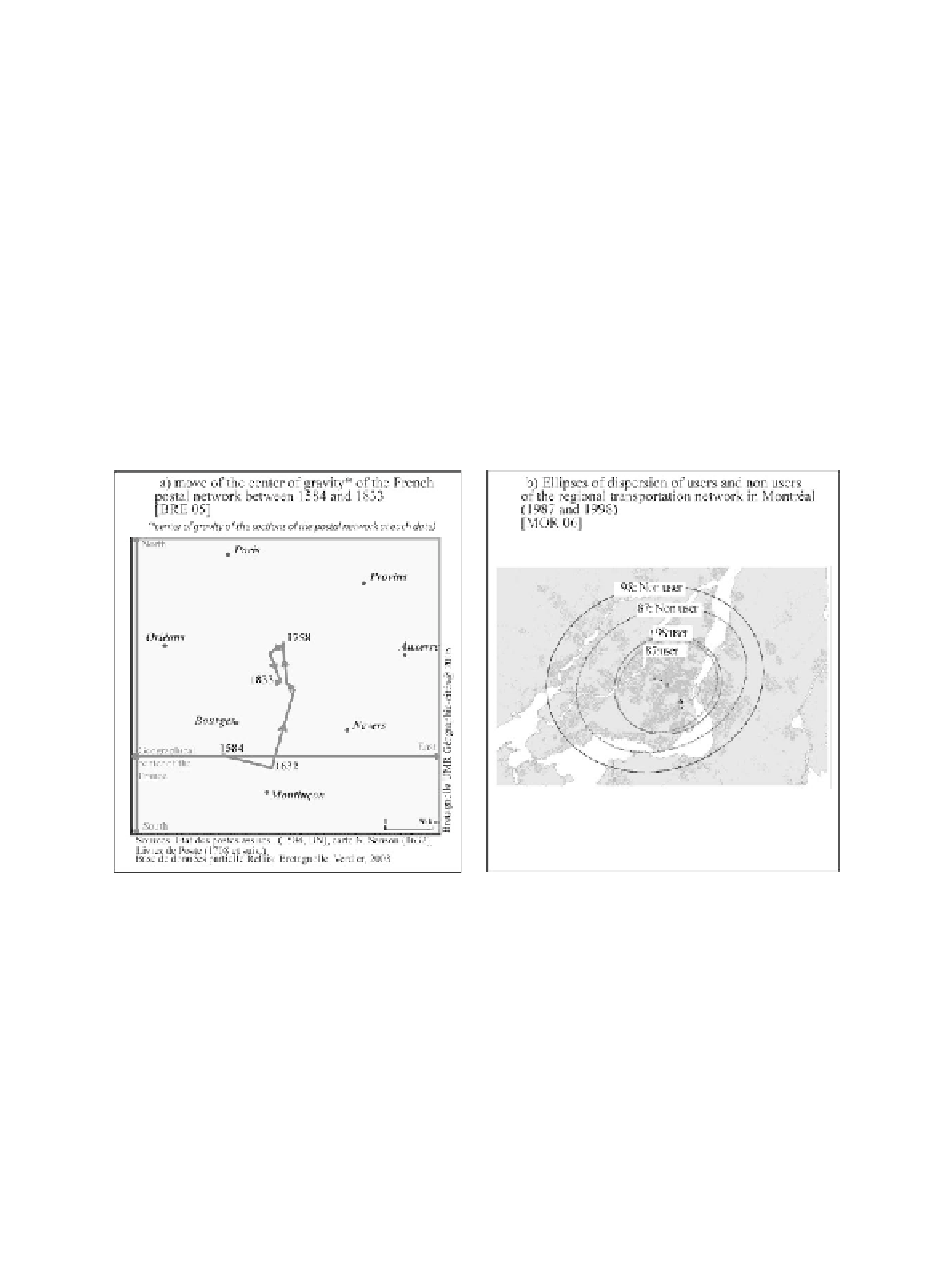
- The gravity center of a set of points allows following the tendency of its spatial
distribution. Thus, in the framework of the analysis of the evolution of the postal
roads in France between 1534 and 1833, the spatial “trajectory” of the gravity center
of the posthouses allows illustrating the manner in which this network of postal
roads has evolved (Figure 3.6(a)). The move of the gravity center toward the West
and then to the North illustrates the fact that the network has heavily become denser,
first around Lyon, then in the North of Paris and this happened very rapidly between
1530 and 1650. This trend stopped around 1750, and the movement of the gravity
center toward the south illustrates a catching up phase with regards to the South that
continues until 1810. Between the last two dates the center of gravity remains fixed,
illustrating that from this point the progression of the network is done in a balanced
manner over the whole of the territory [BRE 05].
Figure 3.6.
Changes at the spatial organization level
- The “dispersion ellipse”, which is an indicator of dispersion around the gravity
center, can also be used to describe the evolution of a punctual phenomenon over
time. It concerns a geometrical shape, from which certain characteristics can be
reused (for example the surface, the maximum radius, or the ratio between the two
radii). Figure 3.6(b) is a good example. The ellipses correspond to the residence
envelope of two categories of persons, according to whether or not they use the