Geoscience Reference
In-Depth Information
2.3.1.2.
Step 2: to explore the dynamics of cities
The database thus constructed, while ensuring the semantics coherence of objects
in time, can be queried in a classic environment of database management. It can also
be queried within a geographic information system that allows in addition a
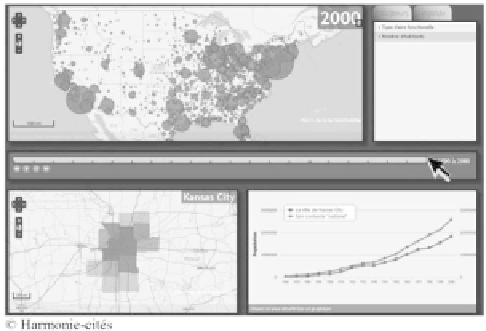
visualization of the spatial extensions of the objects. It may also give rise to
environments of specific questionings such as the one presented in Figure 2.7
[VAN 10]. Here, it is not an environment for the exploration of spatio-temporal
dynamics, but a tool for the visualization of cities' evolution trajectories in an
endurantist
perspective (series of snapshots). Evolution is, therefore, represented
under a kinematics form from a simple time interpolation. Its significance lies in the
fact that it unveils simultaneously and in an animated way the evolution of a city in
its geometric and thematic component (population or surface) at the same time as its
inclusion in the local, regional, national or international urban system, according to
the need. Possible queries are for example: how is the dynamics of this city in
relation to that of the neighboring cities? How is the territory becoming urbanized in
this region?
Figure 2.7.
Animating the cities: exploring the dynamics of cities
(source: [VAN 10, BRE 11]). For a color version of this figure, see
www.iste.co.uk/mathian/spatiotemporal.zip
2.3.1.3.
Step 3: to analyze the differences in the evolution of cities: a trajectories'
typology
The exploration of the evolutions at the elementary level of cities then leads to
an analysis that presents in a synthetic manner the tendencies of these evolutions.
The process, which consists of classifying the population trajectories at the city
level, is very enlightening to illustrate the variety of dynamics at stake, as well as
any discrepancies and their rhythms. We assume here the point of view that consists