Geoscience Reference
In-Depth Information
to have anomalous heat flow or to exhibit anoma-
lous subsidence [
mantleplumes
].
The various components of the global heat
flow budget are given in Table 26.1. [
heat flow
histograms seismic tomography
]
2000
To t a l
1500
1000
Heat loss through continents
The
mean heat flow from continents
is
about 80 mW/m
2
. The median value is closer to
60 mW/m
2
. About half the heat flow through
continents is from the mantle. Continental crust
produces about 0.6--1.2 mW/m
3
of heat and this
accounts for 5.8--8 TW of the global heat flow.
The continental heat flow that is attributed to
the crust itself is 32--40 mW/m
2
. Continents affect
the style of mantle convection and, in fact, influ-
ence the rate at which heat is lost from the man-
tle. The thermal history of the Earth must take
into account the properties of continents and
plates and the fact that the surface boundary con-
dition is not uniform or constant.
Continents
500
Oceans
0
0
15
30
45
60
75
90 105 120 135 150 165 180 195 210
m
2
)
Heat flow (mW
/
0
50
100
150
200
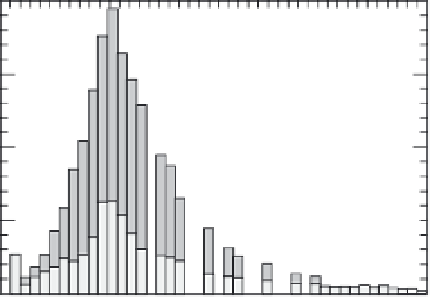
Fig. 26.4
Histograms of heat flow observations.
[
continental oceanic heat flow
]
observed conducted heat flow but there is no the-
oretical basis for this.
Deep, wide oceanic basins are the only regions
of old seafloor where depth represents
ther-
mal isostasy
. When the depths of these
basins are corrected for sediments and crustal
thickness, all the heat-flow data fall at greater
depths than predicted by the 'plate' cooling
model and
there is no relation between
heat flow and age
. The heat flow data and
topography favor discrete or stochastic reheat-
ing events. This reheating could be due to intru-
sions rather than basal heating. Continental
and oceanic heat flow values are compared in
Figure 26.4.
Heat loss through oceans
The estimated mean oceanic heat flux
includ-
ing the unmeasured hydrothermal f lux
is about 50%
larger than the mean continental heat flux.
There is a large difference between the average
(118 mW/m
2
) and the median (65 mW/m
2
) value
for the heat flux from the ocean floor. In order to
get the total heat flux the data must be averaged
by age and by area of the seafloor. These weighted
estimates give about 62 mW/m
2
for the aver-
age. About half of this is a transient effect from
the plate-forming process and half is the back-
ground flux from the mantle. Measured oceanic
heat flow varies from about 300--25 mW/m
2
with
45--55 mW/m
2
being a representative range
through old oceanic crust. The theoretical value
for half-space cooling gives 100 mW/m
2
but this
is sensitive to values adopted for thermal conduc-
tivity of the mantle and crust.
Circulating hot water in the dike injection
zone of midocean ridges removes heat. Near-axis
hydrothermal cooling accounts for about 1 TW of
the global heat flux. The extent of hydrothermal
cooling due to off-axis circulation of cold water
is usually taken as the difference between the
predictions of the plate-cooling model and the
Expected background variations in
heat flow
The boundary layer and plate models attribute
all variations in bathymetry and heat flow to
conductive cooling as a function of time. How-
ever, mantle convection and plate tectonics could
not exist and are inconsistent with an isother-
mal mantle. Lateral temperature variations of the
mantle below the plate of at least 200
◦
Care
expected. For a 100 km thick TBL this implies
heat-flow variations of about 15% superposed
on normal cooling curves. Stochastic intrusions
of dikes into the plate also introduce scatter