Geoscience Reference
In-Depth Information
D
1
Nd
D
2
D
3
Nd
Depletion
Depleted
Primitive
0
Pr
E
3
Enrichment
E
2
E
1
Enriched
0
0
1
2
3
4
Sr
Age (Ga)
D
+
E
D
E
t
3
t
2
t
1
E
3
E
2
E
1
Pr
D
3
D
2
D
1
Pr
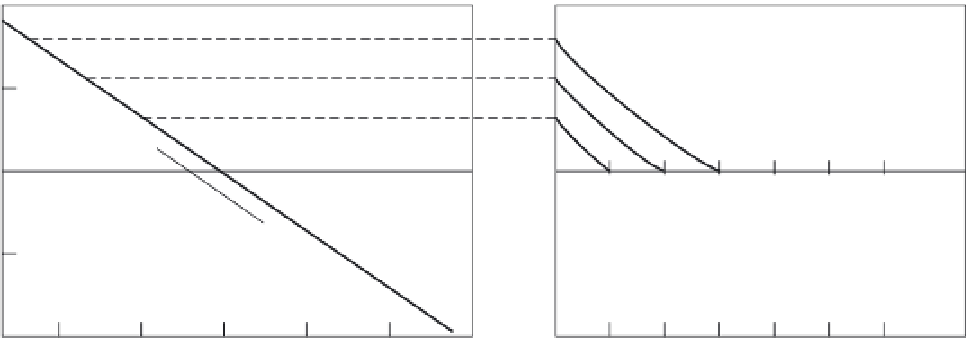
Fig. 25.8
Illustration of isotopic growth in a two-layer
mantle. The lower layer is formed of heavy cumulates,
perhaps at the base of a magma ocean. As it freezes it expels
enriched fluids to the shallow layer (E), thereby becoming
depleted (D). As time goes on, and crystallization proceeds,
the melts become more enriched and more fractionated.
Isotopic growth is more rapid for the parts of the shallow
mantle enriched at later times, but the earlier enriched
reservoirs (E1) have had more time for isotopic growth. The
mantle array can be interpreted as the locus of points
representing magmas from different-aged reservoirs or as a
mixing array between products of enriched and depleted
reservoirs, or some combination. Melts from D may be
contaminated by E if they cannot proceed directly to the
surface. If E is a trace-element-enriched, but infertile,
peridotite, then D may be the main basalt source region,
and enriched basalts may simply represent contaminated
MORB. The enriched component in E may be kimberlitic.
The deeper layer transfers its LIL upward, forming a
depleted layer (D) and a complementary enriched layer
(E). The growth of
ε
Nd
in the depleted and enriched cells
(upper right) combined with similar diagrams for Sr generates
the mantle array (upper left). Magma mixing reduces the
spread of values, decreasing the apparent ages of the
depletion/enrichment events. Layer D may be the transition
region. The cumulate layer could also be lower crustal
cumulates.
Melts from enriched or
heterogenous mantle
Even if the enriched parts of the mantle are
homogenous, their partial melts will have vari-
able LIL contents and ratios such as Rb/Sr, Sm/Nd
and U/Pb that depend on the extent of partial
melting. Magma mixtures, therefore, may appear
to require a range of enriched end-members. A
plot of an isotopic ratio versus a ratio such as
Rb/Sr, Sm/Nd or La/Sm may exhibit considerable
scatter about a two-component mixing line even
if the end-members are isotopically homogenous.
An example is shown in Figure 25.9.
The Rb/Sr of partial melts from this reser-
voir are also shown. The solid lines are mixing
lines between these melts and a melt from the
depleted reservoir having properties estimated
for 'pure MORB.' The dashed lines are labeled by
the fraction of MORB in the mixture. The data
points are representative compositions of vari-
ous basalts; most fall in the field representing
50--95% MORB and an enriched component repre-
senting 2--20% melt from the enriched reservoir.
The Rb/Sr ratio may also be affected by crystal
fractionation and true heterogeneity of one or
both of the two source regions.