Geoscience Reference
In-Depth Information
The maximum compressional wave velocity
in orthopyroxene (along the
a
axis) parallels the
minimum (
b
axis) velocity of olivine. For olivine
b
axis vertical regions of the mantle, as in ophi-
olite peridotites, the vertical P-velocity increases
with orthopyroxene content. The reverse is true
for other directions and for average properties.
Appreciable shear-wave birefringence is expected
in all directions even if the individual shear
velocities do not depend much on azimuth. The
total P-wave variation with azimuth in olivine-
and orthopyroxene-rich aggregates is about 4--6%,
while the S-waves only vary by 1 to 2% (Figure
20.3). The difference between the two shear-wave
polarizations, however, is 4--6%. The azimuthal
variation of S-waves can be expected to be hard
to measure because the maximum velocity differ-
ence occurs over a small angular difference and
because of the long-wavelength nature of shear
waves.
The shear-wave anisotropy in the ilmenite
structure of pyroxene, expected to be important
in the deeper parts of subducted slabs, is quite
pronounced and bears a different relationship to
the P-wave anisotropy than that in peridotites.
One possible manifestation of slab anisotropy is
the variation of travel times with take-off angle
from intermediate- and deep-focus earthquakes.
Fast in-plane velocities, as expected for oriented
olivine, and probably spinel and ilmenite, may
easily be misinterpreted as evidence for deep
slab penetration. The mineral assemblages in
cold slabs are also different from the stable
phases in normal and hot mantle. The colder
phases are generally denser and seismically fast.
Anisotropy and isobaric phase changes in the
source region have been ignored in most studies
purporting to show deep slab penetration into
the lower mantle. There is a trade-off between
the length of a high-velocity slab and its veloc-
ity contrast and anisotropy and structure at the
source.
N
N
8.6
8.3
8.4
8.3
E
E
.25
8.2
.20
Δ
VS
VP
N
N
E
E
.23
s (VS max)
VS max
N
N
4.7
4.7
.26
E
E
4.7
4.8
s (VS min)
VS min
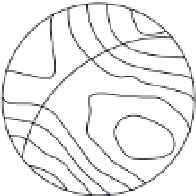
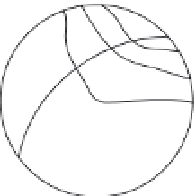
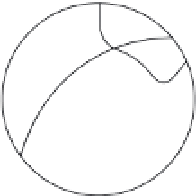
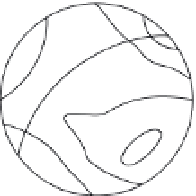
Fig. 20.3
Equal area projection of the acoustic velocities
measured on samples of peridotite. Dashed line is vertical
direction, solid great circle is the horizontal (after
Christensen and Salisbury, 1979).
receive more attention than the acoustic prop-
erties. It is the acoustic or ultrasonic properties,
however, that are most relevant to the inter-
pretation of seismic data. Being crystals, miner-
als exhibit both optical and acoustic anisotropy.
Aggregates of crystals, rocks, are also anisotropic
and display fabrics that can be analyzed in the
same terms used to describe crystal symmetry.
Tables 20.1, 20.2 and 20.3 summarize the acous-
tic anisotropy of some important rock-forming
minerals. Pyroxenes and olivine are unique in
having a greater P-wave anisotropy than S-wave
anisotropy.
Anisotropy of crystals
Because of the simplicity and availability of the
microscope, the optical properties of minerals
Spinel
and
garnet,
cubic
crystals,