Geoscience Reference
In-Depth Information
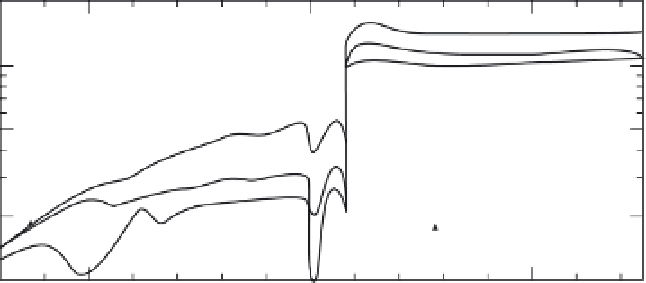
Fig. 19.3
Q of ice containing 2%
NaCl. At low temperatures this is a
solid solution. At temperatures
higher than the eutectic the system
is an ice--brine mixture (Spetzler and
Anderson, 1968).
100
50
Fundamental
First Overtone
Second Overtone
10
−
8
−
12
−
16
−
20
−
24
−
28
−
32
Temperature (
C)
°
f
τ
2
ABSORPTION BAND
Q
m
τ
2
Q
=
Q
m
(
f
τ
2
)
α
0
0
100
10
6
f
τ
i
−
1
−
1
τ
1
10
10
7
−
2
−
2
−
3
−
3
−
4
−
2
0
+
2
+
4
1
10
4
log
f
τ
Fig. 19.4
Schematic illustration of an absorption band.
10
−
1
10
3
way;
10
−
2
10
2
τ
2
)
−
1
Q
=
Q
min
(
f
,
f
<
1
/τ
2
τ
2
)
α
,
10
−
3
10
1
Q
=
Q
min
(
f
1
/τ
2
<
f
<
1
/τ
1
Q
min
(
τ
2
/τ
1
)
α
(
f
τ
1
)
,
Q
=
f
>
1
/τ
1
10
−
4
0
1000
2000
3000
where
f
is the frequency of the wave,
τ
1
is the
Depth (km)
short-period cutoff,
τ
2
is the long-period cutoff
and
Q
min
is the minimum
Q
. These parameters
are shown in Figure 19.4.
The relaxation time for an activated process
depends exponentially on temperature and pres-
sure. Characteristic lengths, such as dislocation
or grain size, are a function of tectonic stress,
which is a function of depth. The location of
the band, therefore, depends on tectonic stress,
temperature and pressure, at least for micro-
scopic mechanisms. The width of the band is con-
trolled by the distribution of relaxation times,
which in turn depends on the distribution of
grain sizes, dislocation lengths and so on.
The effect of pressure dominates over tem-
perature for most of the upper mantle, and tec-
tonic stress decreases with depth and away from
shear boundary layers. The absorption band is
Fig. 19.5
Relaxation times as a function of depth in the
mantle for the absorption band model (ABM) (Anderson and
Given, 1982).
expected to move to longer periods with increas-
ing depth. A reversal of this trend may be caused
by steep stress or temperature gradients across
boundary layers, or by enhanced diffusion due to
the presence of fluids, changes in crystal struc-
ture or in the nature of the point defects. If
we assume that the parameters of the absorp-
tion band are constant throughout the mantle,
we can use the seismic data to determine the
location of the band as a function of depth. This
assumption is equivalent to assuming that the
activation energy, E
∗
, and activation volume, V
∗
,