Geoscience Reference
In-Depth Information
Velocity (km/s)
4
5
8
10
0
200
400
V
S
V
P
Shield
Rise
Arc
Australia
PREM
600
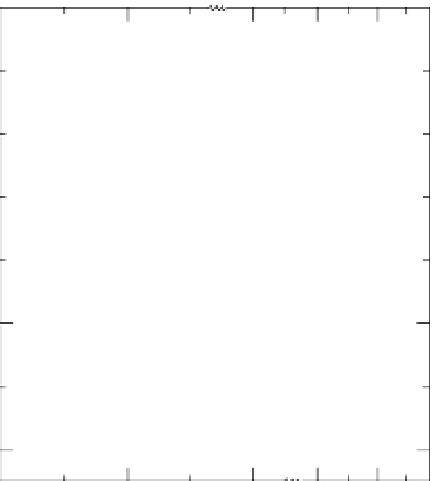
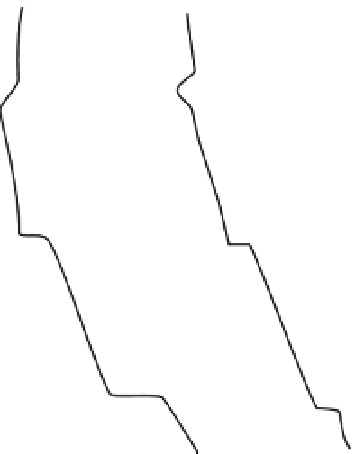
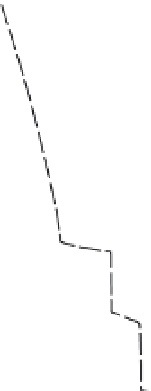
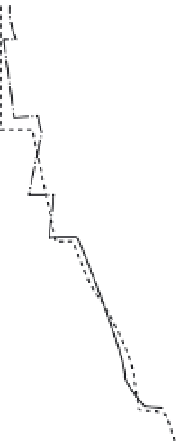
Fig. 11.10
V
s
and
V
p
in various tectonic provinces. Note
the large lateral variations above 200 km and the moderate
variations between 200 and 400 km. The reversal in velocity
between 150 and 200 lcrn under the shield area may
indicate that this is the thickness of the stable shield plate.
Models from Grand and Helmberger (1984a,b) and Walck
(1984).
Fig. 11.11
SH velocities in the upper mantle at depths of
320 to 405 km (after Grand, 1986).
The highest resolution body-wave studies,
involving the use of travel times, apparent
velocities, amplitudes and waveform fitting, have
provided details about upper-mantle velocity
structures in several tectonic regions. Figure 11.10
shows some results. Note that low velocities
extend to depths of about 390 km for the tec-
tonic and oceanic structures. These regional stud-
ies confirm the general features of the global
surface-wave studies. Recent results for the tec-
tonic province of SW USA are available [
Ristra/
ristra.html
].
Although the largest variations (of the order
of 10%) in seismic velocity occur in the upper
200 km of the mantle, the velocities from 200
to about 400 km under oceanic and tectonic
regions are slightly less (on the order of 4% on
average) than under shields. The question then
arises, what is the cause of these deeper veloc-
ity variations? Is the continental plate 400 km
thick or are the velocities between 150--200 and
400 km beneath shields appropriate for 'normal'
subsolidus mantle?
Body-wave tomography of the
lower mantle
The large lateral variations of seismic veloc-
ity in the upper mantle make it difficult to
detect the smaller variations in the lower mantle
and deep small-scale structure. Long-wavelength
velocity and density variations in the lower man-
tle are easier to detect from tomography and
have more influence on the geoid and orien-
tation of the Earth than comparable variations
in the upper mantle.
Body-wave tomography
of the lower mantle
has revealed features
that are similar to the low-order components
of the geoid (Hager and Clayton, 1989). The
polar regions are fast, and the equatorial regions,
in
general,
are
slow.
The
slowest
regions
are