Geoscience Reference
In-Depth Information
12
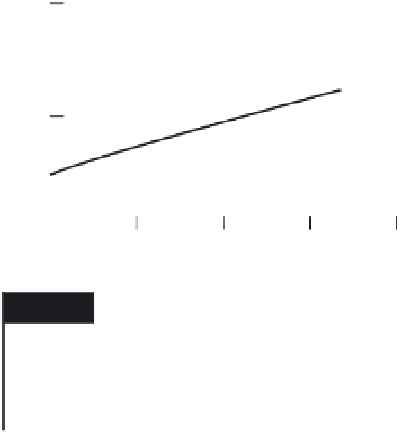
Fig. 8.9
Calculated compressional
velocity versus depth for various
mantle minerals along a 1400
◦
C
adiabat.
st
Mg-pv
11
cor
g
Ca-pv
Na-mj
10
Mg-mj
il
b
mw
jd
Ca-mj
9
py
gr
ol
di
8
opx
7
0
200
400
600
800
1000
Depth (km)
upwellings. However, the depths of the 410 and
650 km discontinuities are uncorrelated on a
global scale. They also sometimes show steps,
which makes interpretation in terms of tempera-
ture not straightforward. Some places show rapid
lateral changes in TZ thickness that may indicate
non-thermal effects. It must therefore be borne
in mind that temperature may not be the only
control. The expected effects of temperature on
the depths of the discontinuities are also based
on uncertain laboratory calibrations, may be in
error by a factor of two, and chemical effects may
be stronger than generally supposed. In spite of
these complications, TZ thickness may still prove
to be a useful thermometer and an important
part of any plan to map lateral variations of tem-
perature in the mantle.
There is no global correlation between TZ
thickness and the locations of surface hotspots
and the large lower-mantle low-velocity regions.
Transition zone thickness is normal beneath
southern Africa (245 km) and the East African
Rift and Afar (244 km), which are underlain
by the postulated 'superplumes' and the pos-
tulated Afar plume. Transition-zone thickness
beneath hotspots is generally within the range
for normal oceans and often close to the global
average.
7
st
cor
Mg-pv
6
Ca-pv
g
Na-mj
il
mw
b
Ca-mj
gr
5
Mg-mj
py
ol
di
opx
jd
4
0
200
400
600
Depth (km)
800
1000
Fig. 8.10
Calculated shear velocity versus depth for various
mantle minerals along a 1400
◦
C adiabat. 'Majorite' (mj),
'perovskite' (pv) and 'ilmenite' (il) are structural, not
mineralogical terms. The dashed lines are two representative
seismic profiles (after Duffy and Anderson, 1989).
242 km;
uncertainties are typically 3%. Typical thick-
nesses beneath high-heat-flow areas are 220--
230 km. The topology of the relevant phase
diagrams predicts antisymmetry in the direc-
tions of deflection of the discontinuities for
the cases of both cold downwellings and hot
The average thickness of the TZ is
∼