Geoscience Reference
In-Depth Information
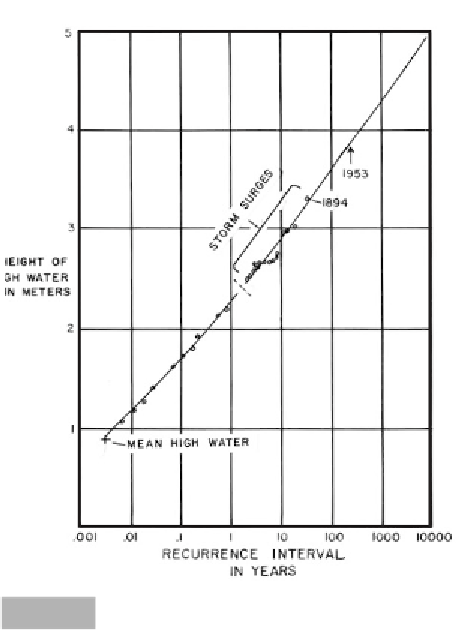
data well. Coincidentally, where the two lines intersect
at a high-water height of 2.4 m is the point separating
storm surges from astronomical tides. The advantage
of a probability plot is that the frequency of an event
can be expressed as a percentage. For example, a storm
surge of 3 m - which in Figure 3.27 plots with a recur-
rence interval of 1:30 years - has a probability of being
exceeded only 3.8 per cent of the time, or once every
26 years (1:26) (see Figure 3.28). Engineers find this
type of diagram convenient and tend to define an event
as rare if it is exceeded 1 per cent of the time. Proba-
bility plots have an additional advantage in that the
probability of low-magnitude events can also be deter-
mined. For instance, annual rainfalls, when ranked and
plotted as recurrence intervals, will not provide any
information about the occurrence of drought. If the
same data are plotted on probability paper, both
the probability of extreme rainfall as well as deficient
rainfall can be determined from the same graph.
Both types of plots have limitations. Firstly, an
extreme event such as a 1:10 000 year storm surge,
while appearing rare, can occur at any time. Secondly,
once a rare event does happen, there is nothing
to preclude that event recurring the next day. This
constitutes a major problem in people's perception of
hazards. Once high-magnitude, low-frequency events
have been experienced, people tend to regard them as
beyond their life experience again. The farmers of the
Chars, having lived through the 1970 storm-surge
event that killed 500 000 people, came back and
re-established their flooded farms with the notion that
they were now safe because such an event was so infre-
quent that it would not recur in their lifetimes. Only 15
years later, a storm surge of similar magnitude
happened again. The 1973 flooding of the Mississippi
River was the greatest on record in 200 years. Within
two years that flood had been exceeded. High-
magnitude events in nature tend to cluster over time
regardless of their frequency. Such
clustering
is related
to the persistence over time of the forcing mechanism
causing the hazard. In the case of storm surges in the
Bay of Bengal, the climatic patterns responsible for
the cyclones may be semi-permanent over the span of
a couple of decades. A third drawback about proba-
bility diagrams is that the baseline for measurements
may change over time. For example, deforestation of a
major drainage basin will cause rare flood events to
become more common. In the case of the Nether-
lands, storm surges in the Middle Ages were certainly
5
4
1953
1894
3
2
1
Mean high water
0
.001
.01
.1
1
10
100
1000 10000
Recurrence interval (yr)
Fig. 3.27
Recurrence intervals of storm surges in the North Sea along
the Netherlands coast for the 70 years before the 1953
February surge event (after Wemelsfelder, 1961).
the Netherlands have been elevated to withstand the
1:10 000 year event with a predicted surge height of 5 m.
Probability of exceedence diagrams
Recurrence intervals can be awkward to interpret,
especially if the period of measurement is limited. In
this case, a probability of exceedence diagram is
favored because it expresses the rarity of an event in
terms of the percentage of time that such an event will
be exceeded. Probability of exceedence diagrams are
constructed by inverting Equation 3.4 as follows:
Exceedence probability =
M
(
N
+ 1)
-1
100%
(3.4)
Data in this form cannot be plotted on logarithmic
paper, but instead are plotted on normal probability
paper. This paper has the same advantage as logarith-
mic paper, in that the probability of occurrence of rare
events beyond the sampling period can be readily
determined, because the data tend to plot along one
or two straight lines. This is shown in Figure 3.28, a
probability plot for the Netherlands storm-surge data
plotted in Figure 3.27. For these data, two lines fit the


