Geoscience Reference
In-Depth Information
A
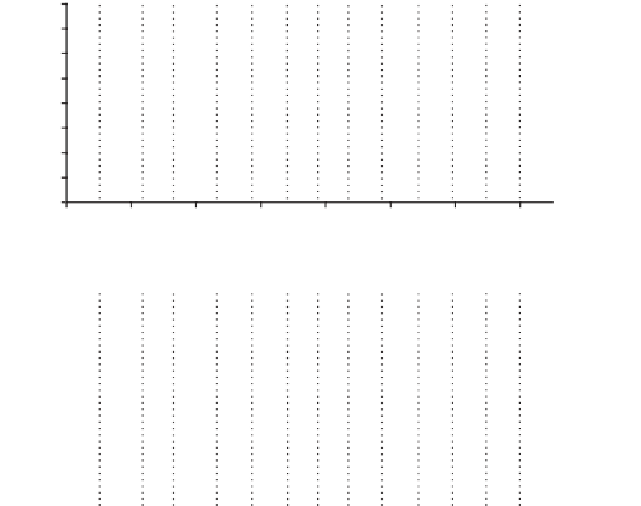
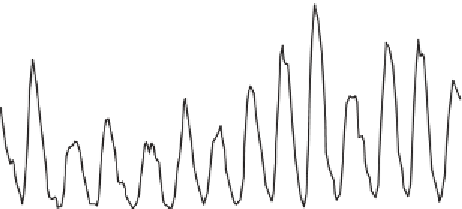
Zurich, Annual Average, Sunspot Numbers 1500-2002
200
180
Maunder
minimum
Dalton
minimum
160
140
120
100
80
60
40
20
0
1500
1600
1700
1800
1900
2000
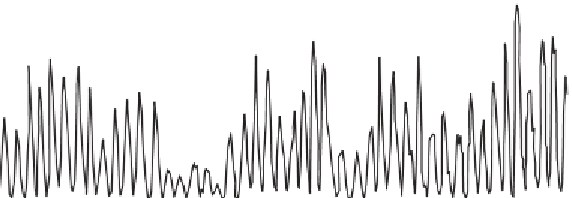
B
AA Geomagnetic Index
40
30
20
10
0
Sunspot Number
200
160
120
80
40
0
1860
1880
1900
1920
1940
1960
1980
2000
A) Time series of the annual average, Zurich sunspot number between the years 1500 and 2002. Values between 1500 and 1749 are from
Shove (1987), between 1750 and 2002 from the National Geophysical Data Centre (2003a). B) Detail of the Zurich sunspot record between
1860 and 2002 with the annual AA geomagnetic index superimposed. Latter from National Geophysical Data Centre (2003b).
Fig. 2.15
accounted for by solar variations. Storm tracks shift
southward by 3-4° latitude in both regions when
sunspot activity is highest. Forest fires are more
numerous in North America at peaks in the sunspot
cycle. The decadal variance in the North Atlantic
Oscillation is also positively correlated to enhanced
geomagnetic activity. Finally, there are solar periodici-
ties in the frequency of earthquakes and volcanic
eruptions. The reason for the latter is beyond the scope
of this text.