Geoscience Reference
In-Depth Information
Japan
A
9
8
7
6
500
1000
1500
2000
9
Tokyo
8
7
1850
1900
1950
2000
Mediterranean
B
9
8
7
6
1900
1920
1940
1960
1980
San Francisco
Alaska
North America
C
9
8
7
6
1850
1900
1950
2000
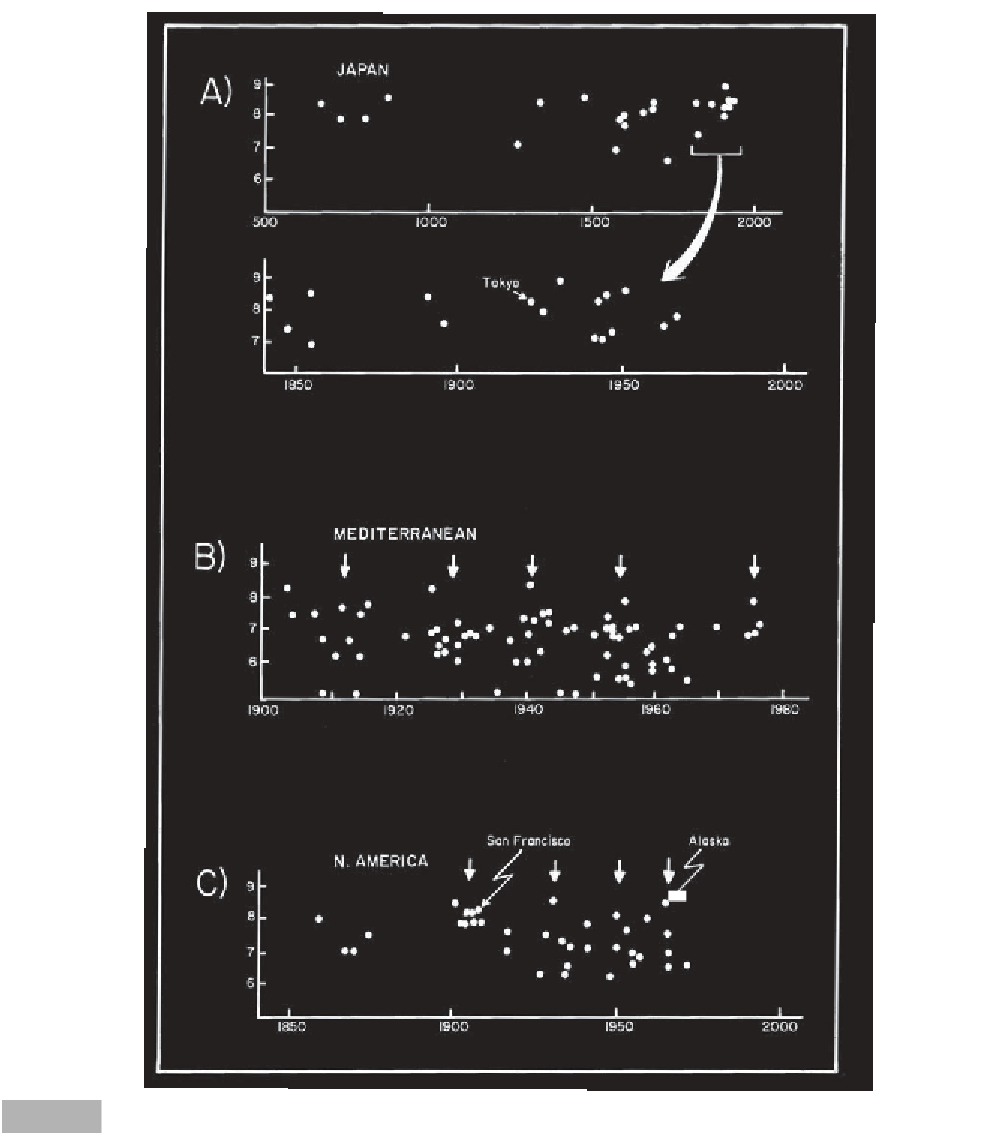
Plot of magnitude on the Richter scale of major earthquakes A) in Japan, B) in the Mediterranean and C) in the United States (based on
Whittow, 1980). Arrows indicate clustering. Updated from <http://earthquake.usgs.gov/activity/past.html>
Fig. 9.11
Pred
iction of seismic activity
subject to a pressure reduction, releasing gas that
increases buoyancy and leads to further upward
movement. This molten material can continue to rise
upward in a runaway process at the rate of 10 cm s
-1
,
eventually rupturing the surface within a week of the
triggering earthquake.
Earthquake cycles
(Wood, 1986)
In 1975, research into earthquake movements in swamp
deposits in the Los Angeles area indicated that there had
been eight major earthquakes since 565 AD, spaced at