Geoscience Reference
In-Depth Information
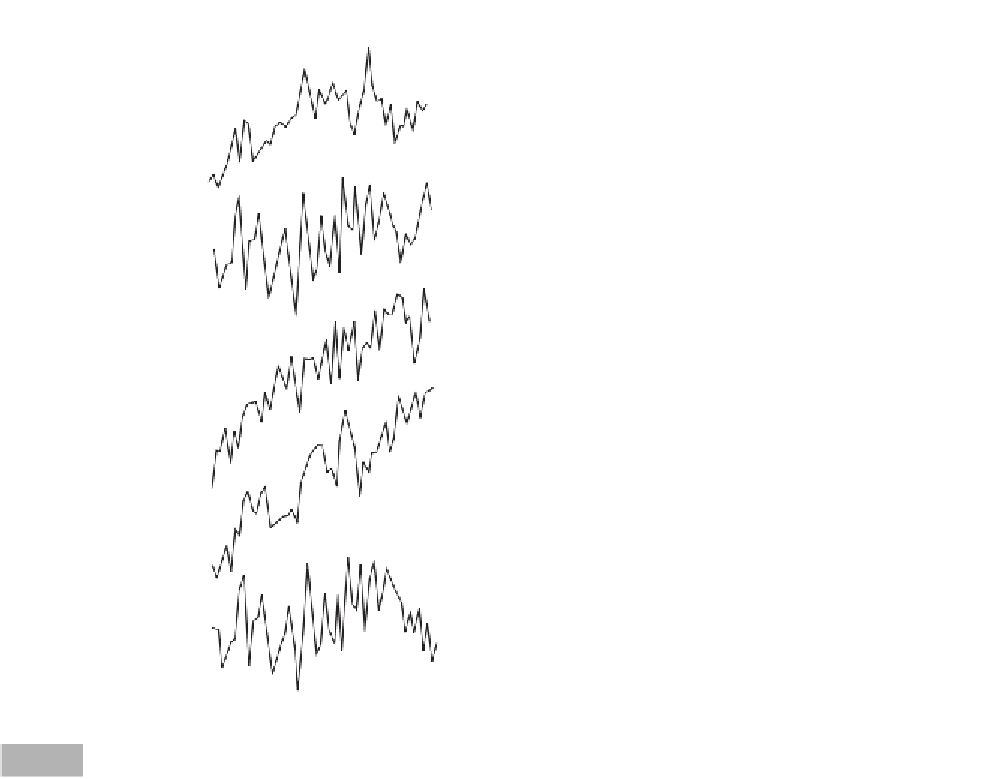
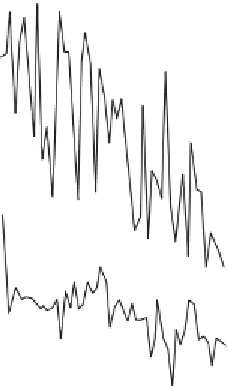
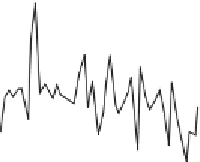
Rising Sea Level
London
(Southend)
Falling Sea Level
Venice
(Trieste)
Stockholm
New York
100
80
60
40
20
0
100
80
60
40
20
0
mm
mm
Wajima, Japan
Tokyo
(Aburatsubo)
Crescent City
West Coast, USA
Sydney
1940
1960
1980
1940
1960
1980
Annual changes in sea level, 1930-1980, at select tide gauges where sea level is either rising or falling.
Fig. 8.9
the United States where uplift very much affects sea
level. In the case of Stockholm, land is still rising as the
result of glacial deloading over 6000 years ago.
Tectonic uplift affects the other two cities. All records
indicate that sea level can at times fall even at places
such as London and Venice where it is rising in the
long term. More importantly, Figure 8.9 indicates that
sea level records are 'noisy'. Globally, the average
annual variability in sea level - as measured by tide
gauges - is 35 mm. This is 20-35 times the hypothe-
sized annual rate of global sea level rise.
Figure 8.10 presents the trends in sea level between
1960 and 1979 at shoreline tide gauges having at least
ten years of data. Note that tide gauges are not the
optimum means for measuring sea level changes. Their
primary purpose is to measure tides in harbors for
navigation - not sea level due to global warming. They
are also unevenly spread across the globe. For these
reasons, only the overall trend in sea level along a
shoreline is plotted in Figure 8.10. Large areas of
consistent sea level change are difficult to delineate
because rates can change from positive to negative
over distances of a few hundred kilometers or less. This
is the case in northern Europe and eastern Asia. For
example, rates range from 24 mm yr
-1
of submergence
along the south-east coast of Japan, to 6.8 mm yr
-1
of emergence along the north-west coast. Sea level
has fallen since 1960 along significant stretches of
coastline, mainly in western Europe, western North
America, and eastern Asia. Increasing sea levels occur
in the Gulf of Mexico; along the eastern coastlines of
North America, South America, and Japan; and the
shorelines of southern Europe.
Satellite altimeters described above that measure
wave heights provide better information about sea
level than tide gauges when results are averaged over
time. The patterns of sea level change measured by
these altimeters over the open ocean between January
1993 and June 2002 are also plotted in Figure 8.10.
There is very little correspondence between the