Geoscience Reference
In-Depth Information
5000
2000
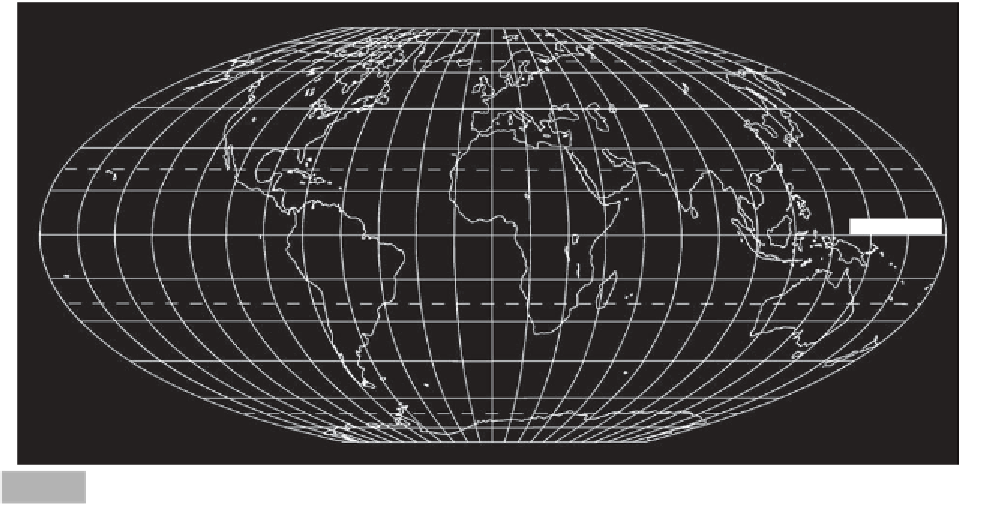
Cherrapunji, India
1000
500
Réunion Island
200
Rapid City
100
Smethport, Pa
Dapto, Australia
D'Hanis, Texas
50
Rockport, W. Va
Holt, Mo
Curtea de Arges, Romania
20
Plum Point, Jamaica
Fussen, Bavaria
10
5
10
20
40 60
3
6
9 12
24
5
10
20 30
2
4
6
12
Minutes
Hours
Days
Months
Duration
Maximum rainfall amounts versus time (adapted from Griffiths, 1976).
Fig. 6.1
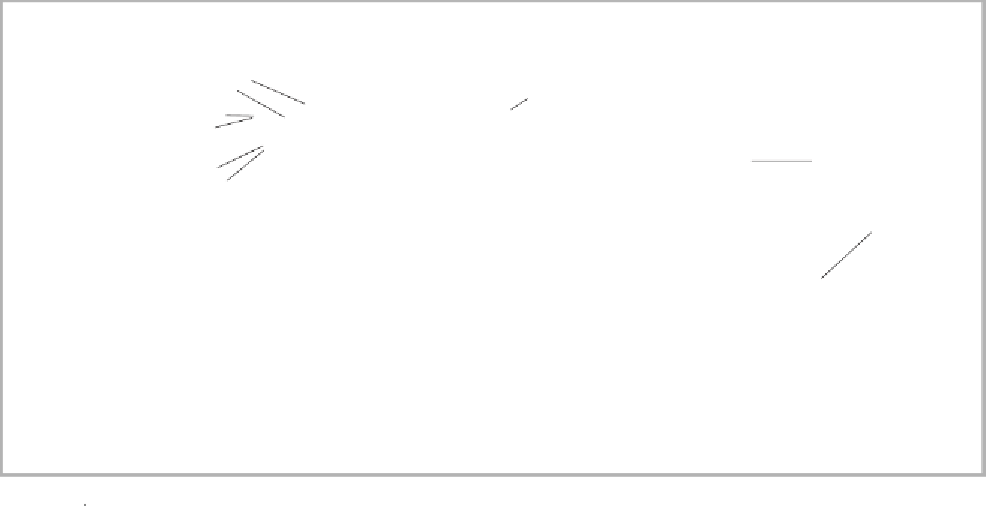
Lake Agassiz
Rapid City
Vaiont Dam
Ousel Cr.
Lake Missoula
St. Lawrence R.
Johnstown
Teton R.
Lake Bonneville
Great Lakes
Cherrapunji
Los Angeles
Three Gorges
Pecos R.
Balcones Escarpment
Bay
of
Bengal
Katherine Gorge
Tully
Sydney
Wollongong
Location map.
Fig. 6.2
R
= 0.42
D
0.475
July 1861 and 22.99 m for all of 1861). In this region,
monsoon winds sweep very unstable and moist air from
the Bay of Bengal up over some of the highest moun-
tains in the world. In Australia, the highest rainfall in
one year (11.3 m) occurred near Tully in Queensland,
a location where orographic uplift of moist air from the
Coral Sea is a common phenomenon in summer.
The following equation (6.1) represents the line of
best fit to the maximum rainfall data in Figure 6.1:
(6.1)
where
R
= rainfall in meters
D
= duration in hours
While this equation fits the data well for periods above
one hour, the line overestimates the amount of rain
that can fall in shorter periods. The latter may merely
represent the undersampling - by the existing network
of
pluviometers
- of spatially small events dropping