Geoscience Reference
In-Depth Information
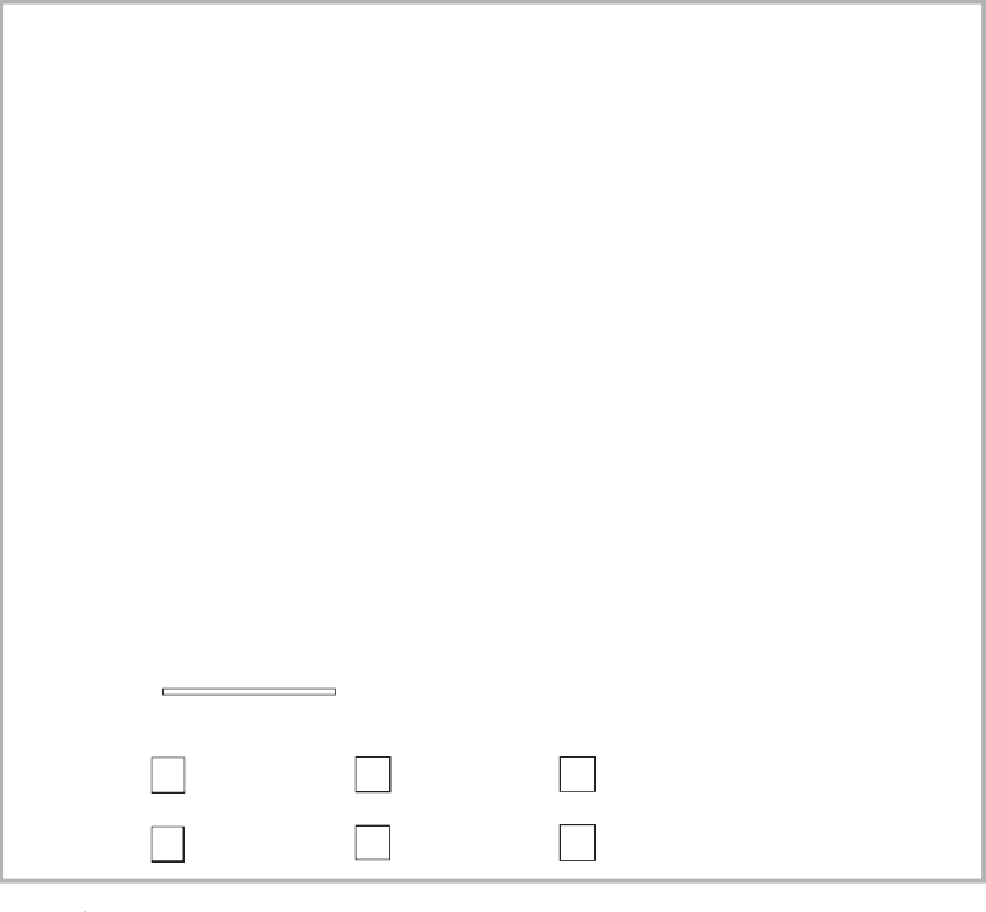
80
10
20
10
0
1000 km
<40
days
50-59
days
70-79
days
40-49
days
60-69
days
>80
days
Average annual thunder days in Australia (based on Oliver, 1986).
Fig. 4.2
frequency strongly parallels the 11-year geomagnetic
cycle.
Because thunderstorms in the United States are so
closely linked to tornado occurrence, the threat of
thunderstorms is forecast daily by evaluating the
degree of atmospheric instability. This is calculated at
93 stations using air temperature measured at the
500 hPa level, and comparing this to a theoretical value
assuming that air has been forced up at the forecast
temperature and humidity for that day. A difference in
temperature of only 4°C has been associated with
tornado development. The largest tornado occurrence
in the United States (when over 148 tornadoes were
recorded in 11 states on 3-4 April 1974) was associated
with a predicted temperature difference of 6°C in the
Mississippi Valley. As well, the movement of thunder-
storms is predictable. Most move in the direction of,
and to the right of, the mean wind. The effect is due
mainly to the strength of cyclonic rotation in the
thunderstorm. In the United States Midwest, thunder-
storm cells also tend to originate in the same place
because of topographic effects. Thunderstorms, like
tornadoes, tend to follow lower lying topography.
Cities, which develop an urban heat island, also attract
thunderstorms. The urban heat island initiates
updrafts, which then draw in any thunderstorms
developing in the area. This phenomenon has been
observed, for example, in both Kansas City, United
States, and London, England (see Figure 4.3 for the
location of major placenames mentioned in this